
move the mouse pointer over that image.
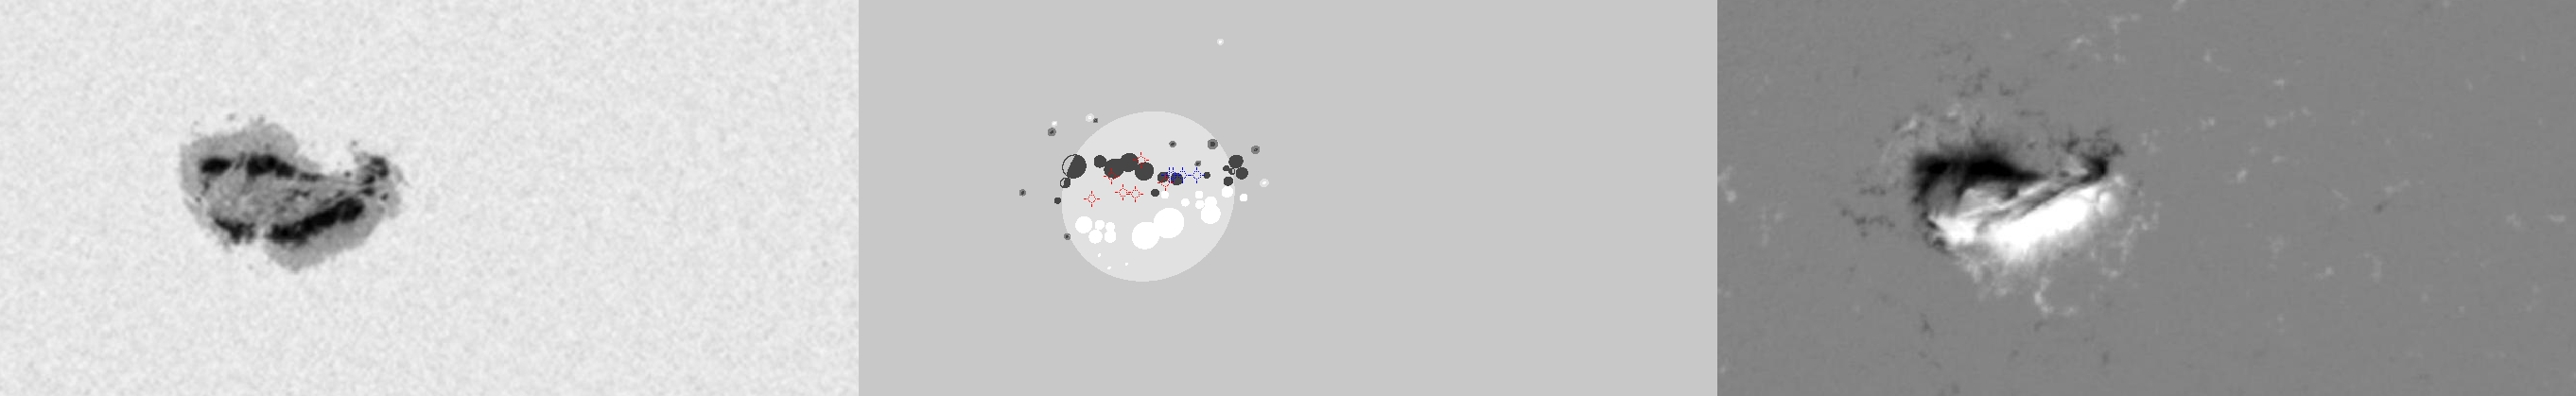
| Evolution of sunspot group NOAA 10720 and positions of flares in it animated by using the data of SOHO/MDI Debrecen Data (SDD) sunspot catalogue (lower panel, middle, ellipses with positions and areas corresponding to the relevant data of spots in SDD and with grey-scale colour coding of the magnetic polarities corresponding to that of the magnetograms), SOHO/MDI continuum images (lower panel, left) and magnetograms (lower panel, right), SOHO/EIT images (upper panel, middle), GOES and RHESSI flare data (red and blue symbols) observed within the interval around the time of SDD data. |
|
When you want to zoom in on one of the images, simply move the mouse pointer over that image. |
 |
| Year | Month | Day | Hour | Min | Sec | NOAA | Proj.U | Proj.WS | Corr.U | Corr.WS | B | L | LCM | Pos.angle | r | MU | MP |
|---|---|---|---|---|---|---|---|---|---|---|---|---|---|---|---|---|---|
| 2005 | 01 | 14 | 15 | 59 | 32 | 10720 | 673 | 3523 | 361 | 1888 | 13.00 | 179.78 | -13.89 | 37.93 | 0.3818 | 305.3 | 122.1 |
| Flare | Date | Start | Peak | End | Dur [s] | Peak [c/s] | Total Counts | Energy [keV] | X pos [asec] | Y pos [asec] | Radial [asec] | B [deg] | L [deg] | Flags |
|---|---|---|---|---|---|---|---|---|---|---|---|---|---|---|
| 5011457 | 14-Jan-2005 | 15:47:20 | 15:50:46 | 16:00:36 | 796 | 471 | 636710 | 25-50 | -204 | 298 | 362 | 13.70 | 180.38 | a0 A1 DF DR P1 |
| 50114182 | 14-Jan-2005 | 16:41:52 | 16:49:02 | 16:54:24 | 752 | 184 | 189468 | 12-25 | -207 | 291 | 357 | 13.26 | 179.68 | a0 A1 DF P1 |
| 50114143 | 14-Jan-2005 | 16:54:24 | 16:57:34 | 16:59:04 | 280 | 80 | 61890 | 12-25 | -201 | 313 | 372 | 14.64 | 179.91 | a0 A1 DF P1 |
| 5011463 | 14-Jan-2005 | 17:26:32 | 17:31:06 | 17:35:24 | 532 | 48 | 67696 | 12-25 | -224 | 288 | 365 | 13.09 | 178.24 | A0 DF DR P1 |
| 50114183 | 14-Jan-2005 | 17:35:24 | 17:41:22 | 17:45:36 | 612 | 147 | 203188 | 25-50 | -200 | 292 | 354 | 13.32 | 179.64 | a0 A1 DF P1 |
| 50114145 | 14-Jan-2005 | 17:45:36 | 17:58:02 | 18:13:12 | 1656 | 2160 | 4256189 | 25-50 | -203 | 303 | 364 | 14.01 | 179.26 | a0 A1 DF DR P1 PE |
| Date | Start | Peak | End | Classification | B [deg] | LCM [deg] |
|---|---|---|---|---|---|---|
| 14-Jan-2005 | 15:24 | 15:51 | 15:56 | C8.0 | 14 | -12 |
| 14-Jan-2005 | 16:55 | 16:58 | 17:03 | C2.5 | 14 | -12 |
| 14-Jan-2005 | 17:35 | 17:42 | 17:50 | C2.8 | 14 | -12 |
| 14-Jan-2005 | 17:53 | 17:57 | 18:03 | M1.5 | 14 | -12 |

