
move the mouse pointer over that image.
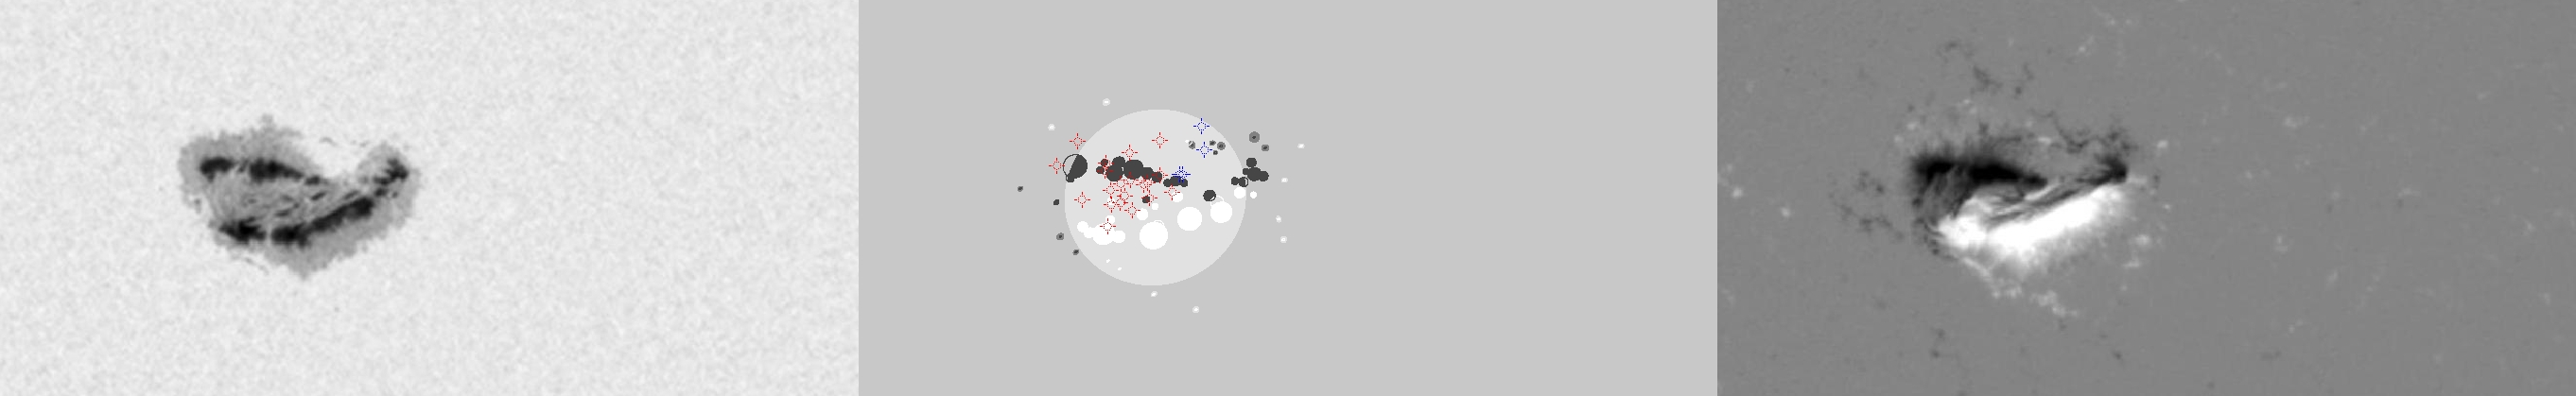
| Evolution of sunspot group NOAA 10720 and positions of flares in it animated by using the data of SOHO/MDI Debrecen Data (SDD) sunspot catalogue (lower panel, middle, ellipses with positions and areas corresponding to the relevant data of spots in SDD and with grey-scale colour coding of the magnetic polarities corresponding to that of the magnetograms), SOHO/MDI continuum images (lower panel, left) and magnetograms (lower panel, right), SOHO/EIT images (upper panel, middle), GOES and RHESSI flare data (red and blue symbols) observed within the interval around the time of SDD data. |
|
When you want to zoom in on one of the images, simply move the mouse pointer over that image. |
 |
| Year | Month | Day | Hour | Min | Sec | NOAA | Proj.U | Proj.WS | Corr.U | Corr.WS | B | L | LCM | Pos.angle | r | MU | MP |
|---|---|---|---|---|---|---|---|---|---|---|---|---|---|---|---|---|---|
| 2005 | 01 | 15 | 01 | 35 | 32 | 10720 | 708 | 3860 | 373 | 2029 | 12.85 | 179.89 | -8.52 | 25.64 | 0.3344 | 373.7 | 74.6 |
| Flare | Date | Start | Peak | End | Dur [s] | Peak [c/s] | Total Counts | Energy [keV] | X pos [asec] | Y pos [asec] | Radial [asec] | B [deg] | L [deg] | Flags |
|---|---|---|---|---|---|---|---|---|---|---|---|---|---|---|
| 5011587 | 15-Jan-2005 | 00:50:32 | 00:52:34 | 00:57:16 | 404 | 9825 | 18552932 | 25-50 | -136 | 304 | 333 | 13.98 | 179.65 | a1 A3 GE P1 PE |
| 5011506 | 15-Jan-2005 | 01:46:12 | 01:50:14 | 01:54:12 | 480 | 33 | 42986 | 25-50 | -126 | 289 | 315 | 13.03 | 179.78 | a0 A1 DF P1 |
| 50115127 | 15-Jan-2005 | 01:54:12 | 01:55:38 | 01:58:32 | 260 | 33 | 20362 | 25-50 | -152 | 270 | 310 | 11.87 | 178.16 | A1 DF P1 |
| 5011589 | 15-Jan-2005 | 01:58:32 | 01:59:14 | 02:02:04 | 212 | 9 | 9619 | 12-25 | -108 | 293 | 312 | 13.27 | 180.79 | A1 DF P1 |
| 5011590 | 15-Jan-2005 | 02:02:04 | 02:05:02 | 02:12:00 | 596 | 14 | 29981 | 6-12 | -123 | 299 | 323 | 13.65 | 179.81 | A1 DF DR P1 |
| 50115128 | 15-Jan-2005 | 02:15:24 | 02:15:38 | 02:16:24 | 60 | 3 | 954 | 6-12 | -122 | 298 | 322 | 13.59 | 179.77 | A0 DF DR P1 |
| 5011507 | 15-Jan-2005 | 02:18:04 | 02:18:46 | 02:24:00 | 356 | 15 | 10577 | 12-25 | -129 | 281 | 309 | 12.53 | 179.35 | A0 DF DR P1 |
| 5011592 | 15-Jan-2005 | 02:29:00 | 02:30:06 | 02:31:24 | 144 | 2 | 1576 | 6-12 | -127 | 301 | 327 | 13.78 | 179.33 | A0 DF P1 |
| 50115129 | 15-Jan-2005 | 02:31:24 | 02:34:54 | 02:35:32 | 248 | 24 | 8166 | 12-25 | -132 | 286 | 315 | 12.84 | 179.00 | A0 DF P1 |
| 50115130 | 15-Jan-2005 | 03:09:44 | 03:10:06 | 03:10:52 | 68 | 9 | 3286 | 6-12 | -119 | 291 | 315 | 13.14 | 179.47 | A0 DF P1 |
| 5011509 | 15-Jan-2005 | 03:16:52 | 03:19:30 | 03:24:32 | 460 | 28 | 32759 | 12-25 | -125 | 285 | 311 | 12.77 | 179.03 | a0 A1 DF P1 |
| 5011593 | 15-Jan-2005 | 03:24:32 | 03:26:02 | 03:30:44 | 372 | 15 | 15688 | 12-25 | -117 | 299 | 322 | 13.64 | 179.44 | A0 DF P1 |
| 5011594 | 15-Jan-2005 | 03:30:44 | 03:37:26 | 03:44:24 | 820 | 34 | 79720 | 12-25 | 71 | -39 | 81 | -6.79 | 190.77 | a0 A1 DF P1 |
| 50115131 | 15-Jan-2005 | 03:44:24 | 03:45:42 | 04:07:32 | 1388 | 16 | 64197 | 6-12 | 84 | -36 | 92 | -6.60 | 191.47 | a0 A1 DF DR P1 |
| 5011598 | 15-Jan-2005 | 04:07:32 | 04:09:54 | 04:11:32 | 240 | 9 | 8851 | 12-25 | -111 | 295 | 315 | 13.38 | 179.41 | A0 DF P1 |
| 5011559 | 15-Jan-2005 | 05:06:28 | 05:07:14 | 05:08:08 | 100 | 40 | 13440 | 12-25 | -113 | 289 | 311 | 13.01 | 178.78 | A1 DF P1 |
| 50115132 | 15-Jan-2005 | 05:25:36 | 05:27:38 | 05:29:00 | 204 | 6 | 6312 | 6-12 | -91 | 313 | 326 | 14.50 | 179.90 | A0 DF P1 |
| 50115133 | 15-Jan-2005 | 05:29:48 | 05:29:54 | 05:30:16 | 28 | 5 | 845 | 6-12 | -75 | 320 | 328 | 14.93 | 180.86 | A0 DF P1 |
| 5011518 | 15-Jan-2005 | 05:32:52 | 05:38:10 | 05:42:20 | 568 | 12 | 27974 | 12-25 | -89 | 308 | 321 | 14.18 | 179.94 | A0 DF P1 |
| 5011599 | 15-Jan-2005 | 05:42:20 | 05:45:50 | 05:47:28 | 308 | 14 | 18930 | 12-25 | -50 | 328 | 331 | 15.43 | 182.25 | A0 DF P1 |
| 5011519 | 15-Jan-2005 | 06:26:56 | 06:27:58 | 06:38:04 | 668 | 1705 | 4957986 | 12-25 | -93 | 328 | 341 | 15.44 | 179.20 | a0 a1 A3 DF GS P1 |
| 50115134 | 15-Jan-2005 | 06:38:04 | 06:40:22 | 06:57:40 | 1176 | 1353 | 6039624 | 25-50 | -103 | 312 | 329 | 14.44 | 178.50 | a1 A3 DF P1 |
| Date | Start | Peak | End | Classification | B [deg] | LCM [deg] |
|---|---|---|---|---|---|---|
| 15-Jan-2005 | 02:34 | 02:39 | 02:44 | C2.9 | 15 | -06 |
| 15-Jan-2005 | 03:16 | 03:40 | 03:57 | C4.2 | -06 | 06 |
| 15-Jan-2005 | 04:09 | 04:16 | 04:22 | M1.3 | 14 | -06 |
| 15-Jan-2005 | 04:26 | 04:31 | 04:36 | M8.4 | 14 | -06 |
| 15-Jan-2005 | 05:54 | 06:38 | 07:17 | M8.6 | 16 | -04 |

