move the mouse pointer over that image.
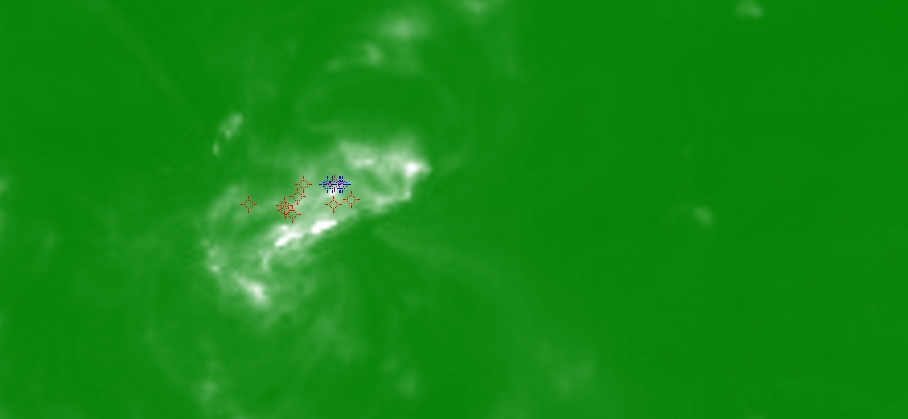
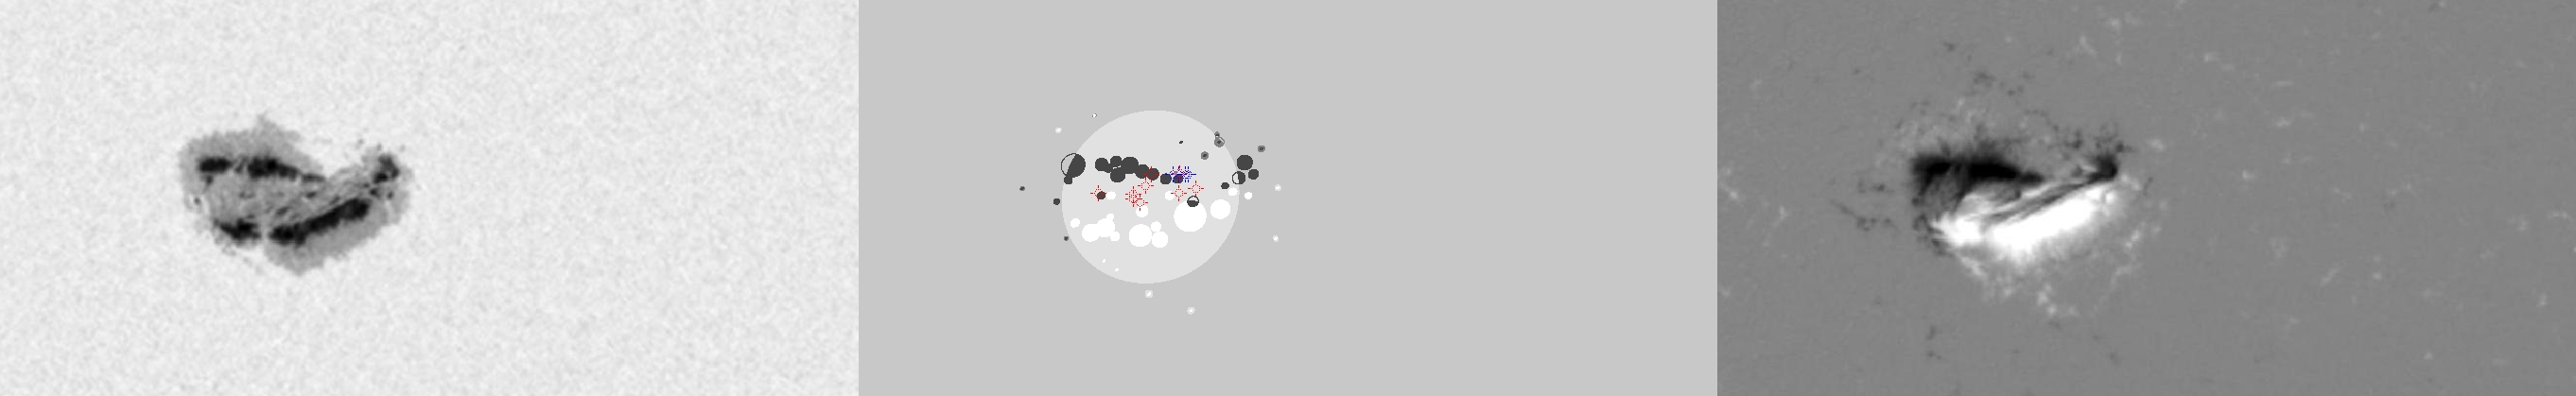
| Evolution of sunspot group NOAA 10720 and positions of flares in it animated by using the data of SOHO/MDI Debrecen Data (SDD) sunspot catalogue (lower panel, middle, ellipses with positions and areas corresponding to the relevant data of spots in SDD and with grey-scale colour coding of the magnetic polarities corresponding to that of the magnetograms), SOHO/MDI continuum images (lower panel, left) and magnetograms (lower panel, right), SOHO/EIT images (upper panel, middle), GOES and RHESSI flare data (red and blue symbols) observed within the interval around the time of SDD data. |
|
When you want to zoom in on one of the images, simply move the mouse pointer over that image. |
 |
| Year | Month | Day | Hour | Min | Sec | NOAA | Proj.U | Proj.WS | Corr.U | Corr.WS | B | L | LCM | Pos.angle | r | MU | MP |
|---|---|---|---|---|---|---|---|---|---|---|---|---|---|---|---|---|---|
| 2005 | 01 | 14 | 20 | 47 | 32 | 10720 | 705 | 3689 | 377 | 1954 | 12.90 | 179.80 | -11.23 | 32.32 | 0.3561 | 367.5 | 95.1 |
| Flare | Date | Start | Peak | End | Dur [s] | Peak [c/s] | Total Counts | Energy [keV] | X pos [asec] | Y pos [asec] | Radial [asec] | B [deg] | L [deg] | Flags |
|---|---|---|---|---|---|---|---|---|---|---|---|---|---|---|
| 50114147 | 14-Jan-2005 | 18:13:12 | 18:26:30 | 18:34:44 | 1292 | 545 | 1102966 | 25-50 | -192 | 304 | 359 | 14.06 | 179.69 | a0 A1 DF DR P1 |
| 50114114 | 14-Jan-2005 | 18:59:28 | 19:03:26 | 19:06:24 | 416 | 12 | 13176 | 12-25 | -171 | 294 | 340 | 13.41 | 180.70 | A0 DF DR P1 |
| 50114184 | 14-Jan-2005 | 19:06:24 | 19:10:38 | 19:23:20 | 1016 | 146 | 207579 | 12-25 | -180 | 291 | 342 | 13.23 | 180.08 | a0 A1 DF DR P1 |
| 5011470 | 14-Jan-2005 | 19:23:20 | 19:29:38 | 19:31:56 | 516 | 22 | 13855 | 12-25 | -200 | 285 | 348 | 12.87 | 178.67 | A0 DF DR P1 |
| 5011471 | 14-Jan-2005 | 19:31:56 | 19:35:10 | 19:42:20 | 624 | 16 | 27561 | 12-25 | 13 | -34 | 36 | -6.47 | 191.70 | A0 DF DR P1 PE |
| 50114150 | 14-Jan-2005 | 19:42:20 | 19:45:42 | 19:51:32 | 552 | 8 | 9745 | 12-25 | -192 | 296 | 353 | 13.55 | 178.99 | A0 DF DR P1 PE |
| 50114151 | 14-Jan-2005 | 19:51:32 | 20:07:26 | 20:11:24 | 1192 | 20 | 37123 | 12-25 | -182 | 304 | 354 | 14.04 | 179.39 | A0 DF DR P1 |
| 50114117 | 14-Jan-2005 | 20:35:36 | 20:40:50 | 20:46:52 | 676 | 6 | 8293 | 12-25 | -184 | 291 | 344 | 13.22 | 179.00 | A0 DF DR P1 |
| 50114185 | 14-Jan-2005 | 20:46:52 | 21:04:50 | 21:08:12 | 1280 | 122 | 137573 | 12-25 | -177 | 288 | 339 | 13.03 | 179.23 | a0 A1 DF DR P1 |
| 50114153 | 14-Jan-2005 | 21:08:12 | 21:18:38 | 21:42:00 | 2028 | 3312 | 12950040 | 12-25 | -196 | 292 | 352 | 13.30 | 177.91 | a0 A1 DF DR GD P1 PE Q5 |
| Date | Start | Peak | End | Classification | B [deg] | LCM [deg] |
|---|---|---|---|---|---|---|
| 14-Jan-2005 | 18:21 | 18:29 | 18:33 | C6.8 | 14 | -11 |
| 14-Jan-2005 | 18:36 | 18:41 | 18:45 | C7.7 | 14 | -11 |
| 14-Jan-2005 | 19:07 | 19:11 | 19:17 | C3.3 | 14 | -11 |
| 14-Jan-2005 | 19:32 | 19:36 | 19:43 | C1.4 | 14 | -11 |
| 14-Jan-2005 | 20:26 | 20:30 | 20:35 | C1.2 | 14 | -10 |
| 14-Jan-2005 | 21:08 | 21:26 | 21:39 | M1.9 | 14 | -10 |

