
move the mouse pointer over that image.
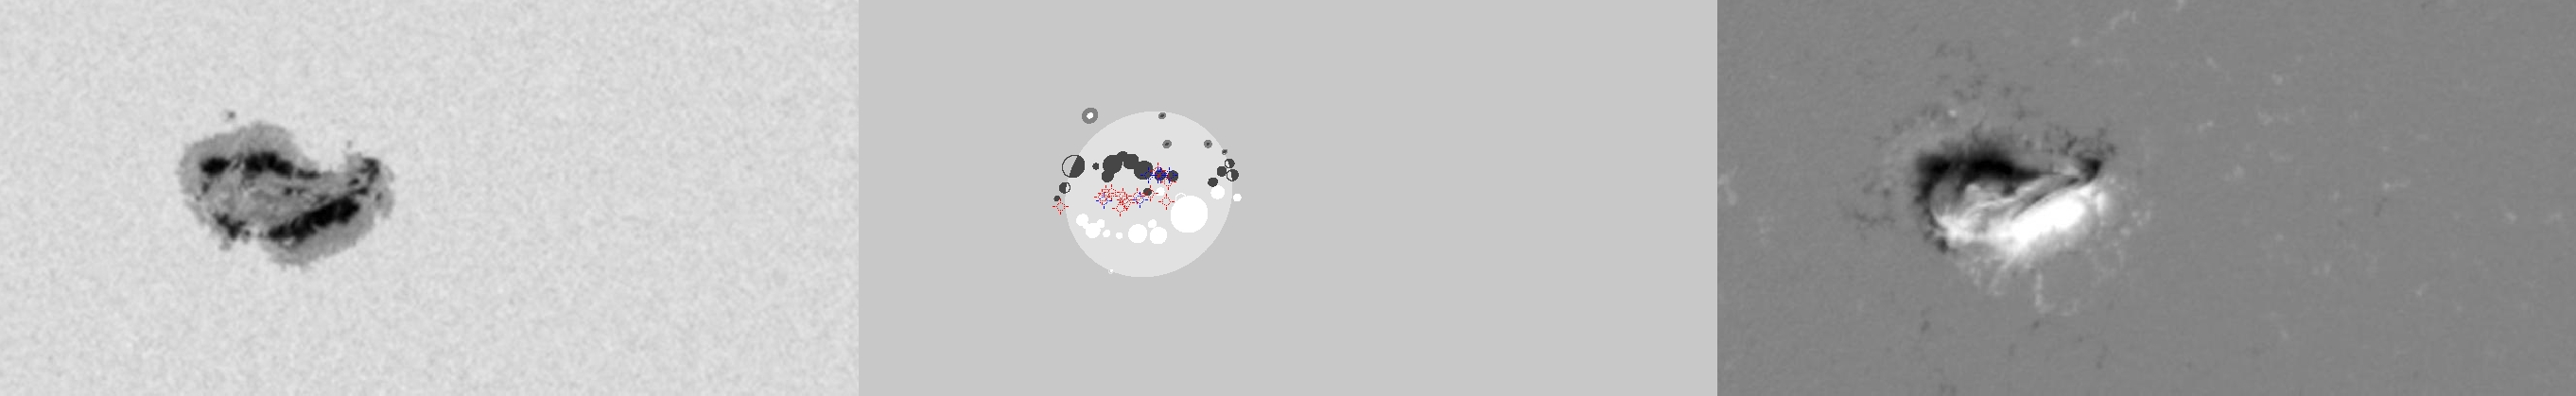
| Evolution of sunspot group NOAA 10720 and positions of flares in it animated by using the data of SOHO/MDI Debrecen Data (SDD) sunspot catalogue (lower panel, middle, ellipses with positions and areas corresponding to the relevant data of spots in SDD and with grey-scale colour coding of the magnetic polarities corresponding to that of the magnetograms), SOHO/MDI continuum images (lower panel, left) and magnetograms (lower panel, right), SOHO/EIT images (upper panel, middle), GOES and RHESSI flare data (red and blue symbols) observed within the interval around the time of SDD data. |
|
When you want to zoom in on one of the images, simply move the mouse pointer over that image. |
 |
| Year | Month | Day | Hour | Min | Sec | NOAA | Proj.U | Proj.WS | Corr.U | Corr.WS | B | L | LCM | Pos.angle | r | MU | MP |
|---|---|---|---|---|---|---|---|---|---|---|---|---|---|---|---|---|---|
| 2005 | 01 | 14 | 11 | 35 | 32 | 10720 | 624 | 3298 | 337 | 1787 | 13.10 | 179.86 | -16.23 | 42.17 | 0.4066 | 275.5 | 132.1 |
| Flare | Date | Start | Peak | End | Dur [s] | Peak [c/s] | Total Counts | Energy [keV] | X pos [asec] | Y pos [asec] | Radial [asec] | B [deg] | L [deg] | Flags |
|---|---|---|---|---|---|---|---|---|---|---|---|---|---|---|
| 50114106 | 14-Jan-2005 | 08:08:16 | 08:12:54 | 08:18:12 | 596 | 45 | 27142 | 12-25 | -306 | 288 | 421 | 13.25 | 178.11 | A0 GS P1 |
| 5011432 | 14-Jan-2005 | 08:21:04 | 08:25:14 | 08:33:24 | 740 | 32 | 73788 | 12-25 | -319 | 284 | 427 | 13.02 | 177.17 | A0 |
| 50114174 | 14-Jan-2005 | 08:33:24 | 08:35:58 | 08:44:12 | 648 | 120 | 133547 | 12-25 | -289 | 283 | 405 | 12.91 | 179.02 | a0 A1 |
| 50114126 | 14-Jan-2005 | 08:44:12 | 08:57:18 | 08:59:04 | 892 | 160 | 204710 | 12-25 | -309 | 282 | 419 | 12.88 | 177.54 | a0 A1 DF EE P1 |
| 50114108 | 14-Jan-2005 | 09:23:12 | 09:25:30 | 09:26:36 | 204 | 1411 | 908577 | 12-25 | -303 | 287 | 417 | 13.18 | 177.64 | A0 DF GE P1 PE |
| 50114129 | 14-Jan-2005 | 09:45:12 | 09:45:58 | 09:48:28 | 196 | 206 | 201908 | 6-12 | -288 | 287 | 407 | 13.15 | 178.42 | A0 DF GS P1 |
| 50114175 | 14-Jan-2005 | 09:48:28 | 09:54:46 | 10:07:12 | 1124 | 924 | 1261932 | 12-25 | -336 | 280 | 437 | 12.80 | 175.26 | A0 DF P1 |
| 5011437 | 14-Jan-2005 | 10:07:12 | 10:15:02 | 10:32:04 | 1492 | 1840 | 2416248 | 25-50 | -266 | 304 | 404 | 14.18 | 179.49 | a0 A1 DF P1 |
| 50114111 | 14-Jan-2005 | 10:59:32 | 11:00:10 | 11:04:24 | 292 | 1 | 1503 | 6-12 | -284 | 290 | 406 | 13.33 | 177.99 | A0 DF P1 PE |
| 50114176 | 14-Jan-2005 | 11:04:24 | 11:13:02 | 11:20:52 | 988 | 11 | 16155 | 12-25 | -243 | 297 | 383 | 13.71 | 180.46 | A0 DF P1 PE |
| 5011440 | 14-Jan-2005 | 11:20:52 | 11:22:26 | 11:25:16 | 264 | 7 | 4953 | 12-25 | -272 | 280 | 391 | 12.68 | 178.60 | A0 DF P1 |
| 50114112 | 14-Jan-2005 | 11:25:16 | 11:29:46 | 11:33:12 | 476 | 15 | 21822 | 12-25 | -282 | 287 | 402 | 13.14 | 177.86 | A0 DF DR P1 |
| 50114130 | 14-Jan-2005 | 11:48:40 | 11:56:58 | 12:11:04 | 1344 | 184 | 368203 | 12-25 | -272 | 290 | 398 | 13.31 | 178.24 | a0 A1 DF P1 |
| Date | Start | Peak | End | Classification | B [deg] | LCM [deg] |
|---|---|---|---|---|---|---|
| 14-Jan-2005 | 07:23 | 07:38 | 07:43 | C6.8 | 14 | -18 |
| 14-Jan-2005 | 08:21 | 08:37 | 08:44 | C1.4 | 14 | -17 |
| 14-Jan-2005 | 08:54 | 08:58 | 09:01 | C1.8 | 13 | -18 |
| 14-Jan-2005 | 09:12 | 09:17 | 09:23 | C1.9 | 14 | -17 |
| 14-Jan-2005 | 09:51 | 09:55 | 09:58 | C1.0 | 13 | -19 |
| 14-Jan-2005 | 10:08 | 10:20 | 10:26 | C8.9 | -06 | -05 |
| 14-Jan-2005 | 12:02 | 12:05 | 12:08 | C2.1 | 14 | -16 |

