move the mouse pointer over that image.
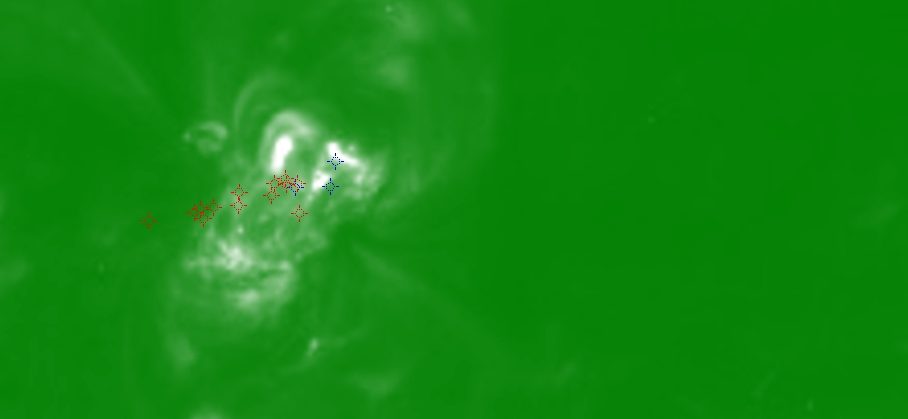
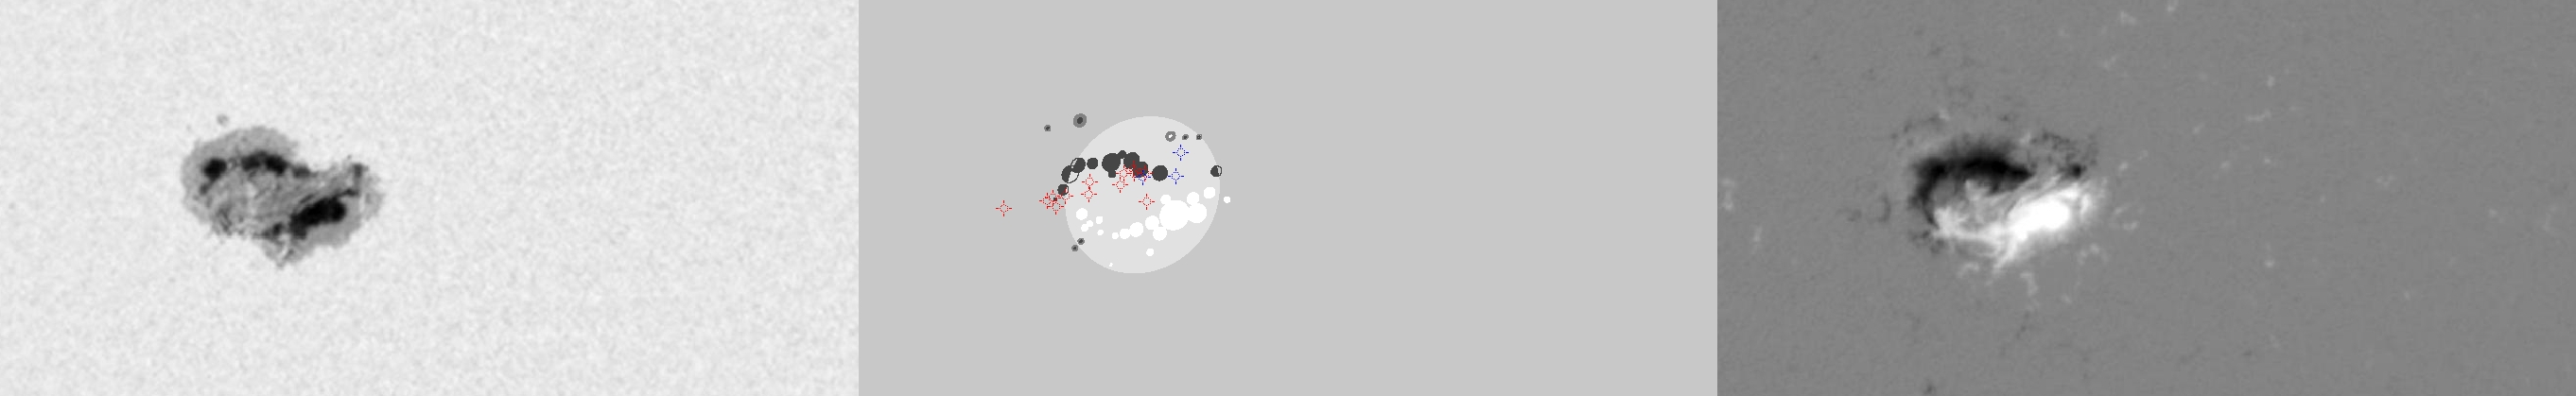
| Evolution of sunspot group NOAA 10720 and positions of flares in it animated by using the data of SOHO/MDI Debrecen Data (SDD) sunspot catalogue (lower panel, middle, ellipses with positions and areas corresponding to the relevant data of spots in SDD and with grey-scale colour coding of the magnetic polarities corresponding to that of the magnetograms), SOHO/MDI continuum images (lower panel, left) and magnetograms (lower panel, right), SOHO/EIT images (upper panel, middle), GOES and RHESSI flare data (red and blue symbols) observed within the interval around the time of SDD data. |
|
When you want to zoom in on one of the images, simply move the mouse pointer over that image. |
 |
| Year | Month | Day | Hour | Min | Sec | NOAA | Proj.U | Proj.WS | Corr.U | Corr.WS | B | L | LCM | Pos.angle | r | MU | MP |
|---|---|---|---|---|---|---|---|---|---|---|---|---|---|---|---|---|---|
| 2005 | 01 | 14 | 03 | 11 | 32 | 10720 | 527 | 2888 | 293 | 1609 | 13.18 | 179.75 | -20.95 | 49.39 | 0.4600 | 282.8 | 93.4 |
| Flare | Date | Start | Peak | End | Dur [s] | Peak [c/s] | Total Counts | Energy [keV] | X pos [asec] | Y pos [asec] | Radial [asec] | B [deg] | L [deg] | Flags |
|---|---|---|---|---|---|---|---|---|---|---|---|---|---|---|
| 50114166 | 14-Jan-2005 | 02:24:20 | 02:25:42 | 02:29:36 | 316 | 184 | 244128 | 6-12 | -341 | 301 | 455 | 14.15 | 178.91 | A0 |
| 50114168 | 14-Jan-2005 | 03:15:52 | 03:16:30 | 03:16:56 | 64 | 6 | 1837 | 12-25 | -336 | 294 | 447 | 13.70 | 178.82 | A0 |
| 50114169 | 14-Jan-2005 | 03:21:20 | 03:21:58 | 03:22:44 | 84 | 5 | 1463 | 12-25 | -317 | 283 | 425 | 12.98 | 180.08 | A0 |
| 50114170 | 14-Jan-2005 | 03:28:00 | 03:29:34 | 03:32:16 | 256 | 3 | 2305 | 6-12 | -324 | 305 | 445 | 14.37 | 179.43 | A0 |
| 50114103 | 14-Jan-2005 | 03:32:16 | 03:37:42 | 03:43:28 | 672 | 16 | 18472 | 12-25 | -314 | 302 | 435 | 14.16 | 180.03 | A0 |
| 50114171 | 14-Jan-2005 | 05:04:56 | 05:06:10 | 05:07:04 | 128 | 20 | 11808 | 12-25 | -327 | 289 | 436 | 13.36 | 178.44 | A1 |
| 5011419 | 14-Jan-2005 | 05:18:08 | 05:19:18 | 05:20:52 | 164 | 34 | 22080 | 12-25 | -345 | 281 | 445 | 12.89 | 177.18 | A1 |
| 50114105 | 14-Jan-2005 | 05:28:20 | 05:29:02 | 05:30:52 | 152 | 17 | 12241 | 6-12 | -345 | 287 | 449 | 13.27 | 177.06 | A0 |
| 5011422 | 14-Jan-2005 | 05:35:20 | 05:40:30 | 05:45:56 | 636 | 96 | 88478 | 12-25 | -294 | 303 | 422 | 14.18 | 180.20 | A0 |
| 5011426 | 14-Jan-2005 | 06:28:00 | 06:34:06 | 06:38:08 | 608 | 200 | 280512 | 6-12 | -302 | 298 | 424 | 13.88 | 179.22 | A0 GS P1 PE |
| 50114172 | 14-Jan-2005 | 06:38:08 | 06:52:30 | 07:01:08 | 1380 | 2288 | 3878832 | 12-25 | -313 | 289 | 426 | 13.33 | 178.38 | A0 |
| 50114125 | 14-Jan-2005 | 07:01:08 | 07:03:50 | 07:06:36 | 328 | 1008 | 534240 | 12-25 | -352 | 281 | 451 | 12.90 | 175.77 | A0 |
| 5011428 | 14-Jan-2005 | 07:06:36 | 07:08:42 | 07:13:24 | 408 | 624 | 379968 | 12-25 | -321 | 286 | 430 | 13.16 | 177.73 | A0 |
| Date | Start | Peak | End | Classification | B [deg] | LCM [deg] |
|---|---|---|---|---|---|---|
| 14-Jan-2005 | 02:36 | 02:43 | 02:54 | C1.4 | -06 | -09 |
| 14-Jan-2005 | 05:45 | 05:49 | 05:52 | C1.0 | 15 | -18 |
| 14-Jan-2005 | 06:01 | 06:04 | 06:10 | B6.7 | 14 | -18 |
| 14-Jan-2005 | 06:48 | 06:53 | 06:57 | B8.1 | 14 | -19 |

