
move the mouse pointer over that image.
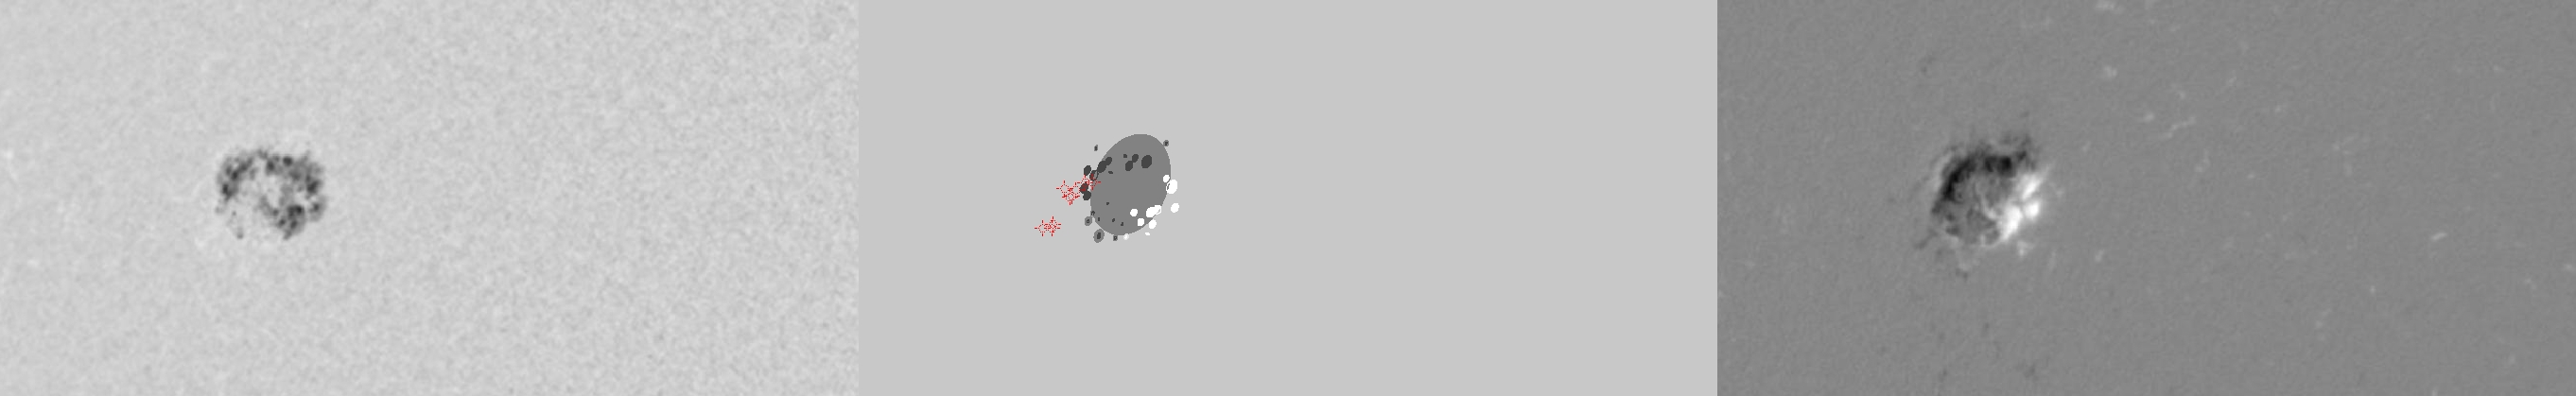
| Evolution of sunspot group NOAA 10720 and positions of flares in it animated by using the data of SOHO/MDI Debrecen Data (SDD) sunspot catalogue (lower panel, middle, ellipses with positions and areas corresponding to the relevant data of spots in SDD and with grey-scale colour coding of the magnetic polarities corresponding to that of the magnetograms), SOHO/MDI continuum images (lower panel, left) and magnetograms (lower panel, right), SOHO/EIT images (upper panel, middle), GOES and RHESSI flare data (red and blue symbols) observed within the interval around the time of SDD data. |
|
When you want to zoom in on one of the images, simply move the mouse pointer over that image. |
 |
| Year | Month | Day | Hour | Min | Sec | NOAA | Proj.U | Proj.WS | Corr.U | Corr.WS | B | L | LCM | Pos.angle | r | MU | MP |
|---|---|---|---|---|---|---|---|---|---|---|---|---|---|---|---|---|---|
| 2005 | 01 | 12 | 12 | 47 | 32 | 10720 | 139 | 969 | 99 | 691 | 13.73 | 179.03 | -42.75 | 66.26 | 0.7224 | -160.4 | -121.5 |
| Flare | Date | Start | Peak | End | Dur [s] | Peak [c/s] | Total Counts | Energy [keV] | X pos [asec] | Y pos [asec] | Radial [asec] | B [deg] | L [deg] | Flags |
|---|---|---|---|---|---|---|---|---|---|---|---|---|---|---|
| 5011265 | 12-Jan-2005 | 12:02:44 | 12:04:02 | 12:05:00 | 136 | 34 | 19968 | 6-12 | -663 | 282 | 721 | 14.11 | 176.09 | A0 |
| 5011266 | 12-Jan-2005 | 12:36:12 | 12:39:02 | 12:40:56 | 284 | 24 | 26616 | 6-12 | -651 | 283 | 710 | 14.11 | 176.81 | A0 DR P1 |
| 50112105 | 12-Jan-2005 | 12:40:56 | 12:44:14 | 12:50:24 | 568 | 60 | 83496 | 6-12 | -665 | 273 | 719 | 13.55 | 175.69 | A0 |
| 5011268 | 12-Jan-2005 | 12:51:36 | 12:54:46 | 12:59:04 | 448 | 42 | 64584 | 6-12 | -661 | 274 | 716 | 13.59 | 175.93 | A0 |
| 5011209 | 12-Jan-2005 | 13:02:08 | 13:02:54 | 13:07:36 | 328 | 256 | 88248 | 12-25 | -657 | 278 | 714 | 13.82 | 176.15 | A0 |
| 5011269 | 12-Jan-2005 | 13:07:36 | 13:10:38 | 13:13:48 | 372 | 28 | 41232 | 6-12 | -663 | 279 | 719 | 13.92 | 175.53 | A0 DR P1 |
| 5011270 | 12-Jan-2005 | 13:13:48 | 13:17:02 | 13:21:44 | 476 | 60 | 66624 | 6-12 | -676 | 253 | 722 | 12.34 | 174.71 | A0 DR P1 |
| 5011271 | 12-Jan-2005 | 13:26:56 | 13:27:26 | 13:28:04 | 68 | 32 | 8424 | 6-12 | -668 | 253 | 715 | 12.30 | 175.33 | A0 |
| 5011272 | 12-Jan-2005 | 13:32:32 | 13:33:10 | 13:35:44 | 192 | 24 | 18456 | 6-12 | -666 | 256 | 714 | 12.48 | 175.41 | A0 |
| Date | Start | Peak | End | Classification | B [deg] | LCM [deg] |
|---|---|---|---|---|---|---|
| No data |

