
move the mouse pointer over that image.
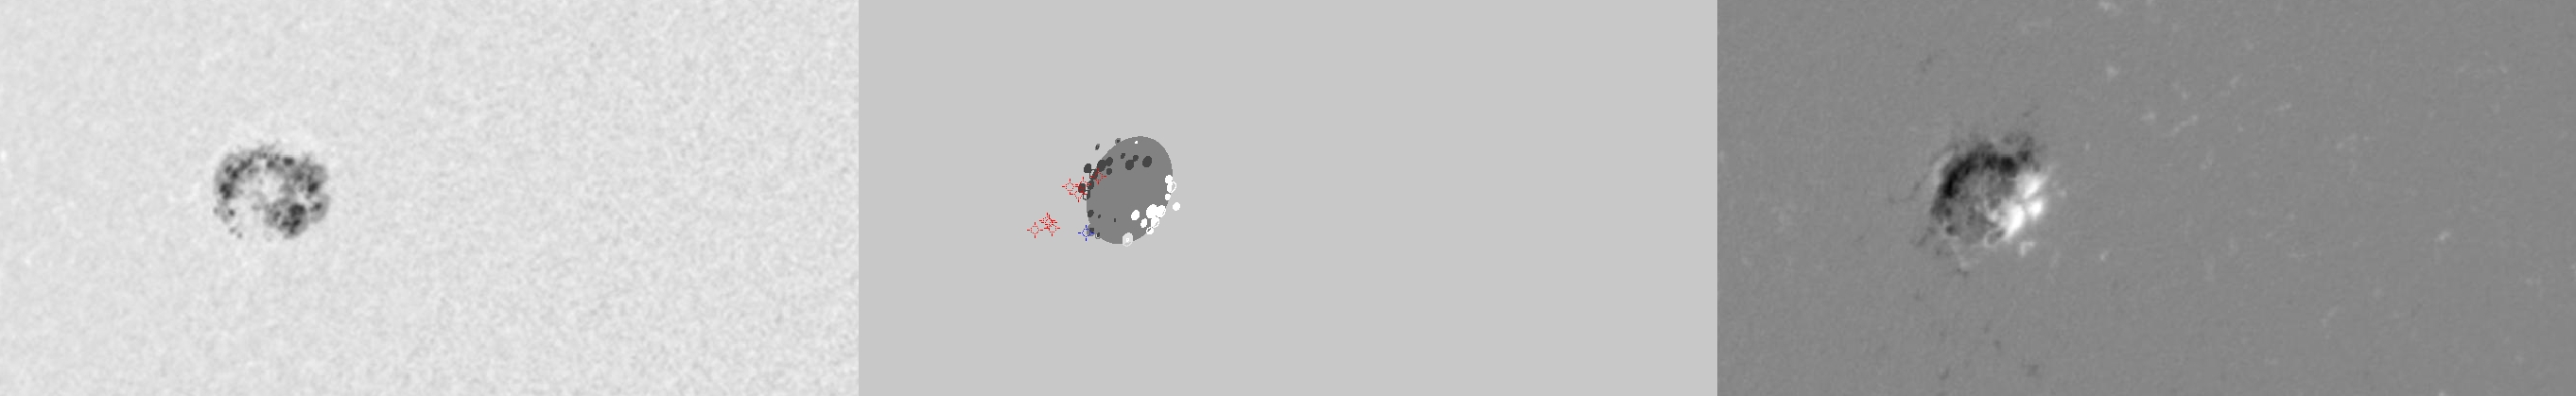
| Evolution of sunspot group NOAA 10720 and positions of flares in it animated by using the data of SOHO/MDI Debrecen Data (SDD) sunspot catalogue (lower panel, middle, ellipses with positions and areas corresponding to the relevant data of spots in SDD and with grey-scale colour coding of the magnetic polarities corresponding to that of the magnetograms), SOHO/MDI continuum images (lower panel, left) and magnetograms (lower panel, right), SOHO/EIT images (upper panel, middle), GOES and RHESSI flare data (red and blue symbols) observed within the interval around the time of SDD data. |
|
When you want to zoom in on one of the images, simply move the mouse pointer over that image. |
 |
| Year | Month | Day | Hour | Min | Sec | NOAA | Proj.U | Proj.WS | Corr.U | Corr.WS | B | L | LCM | Pos.angle | r | MU | MP |
|---|---|---|---|---|---|---|---|---|---|---|---|---|---|---|---|---|---|
| 2005 | 01 | 12 | 14 | 23 | 32 | 10720 | 167 | 1097 | 117 | 771 | 13.52 | 179.06 | -41.84 | 66.10 | 0.7114 | -74.6 | -136.4 |
| Flare | Date | Start | Peak | End | Dur [s] | Peak [c/s] | Total Counts | Energy [keV] | X pos [asec] | Y pos [asec] | Radial [asec] | B [deg] | L [deg] | Flags |
|---|---|---|---|---|---|---|---|---|---|---|---|---|---|---|
| 5011210 | 12-Jan-2005 | 13:38:52 | 13:40:54 | 13:43:24 | 272 | 160 | 92736 | 12-25 | -676 | 256 | 723 | 12.53 | 174.45 | A0 |
| 5011273 | 12-Jan-2005 | 14:11:56 | 14:12:50 | 14:17:28 | 332 | 22 | 32280 | 6-12 | -679 | 252 | 724 | 12.29 | 173.95 | A0 DR P1 |
| 50112106 | 12-Jan-2005 | 14:17:28 | 14:19:46 | 14:22:00 | 272 | 22 | 26760 | 6-12 | -666 | 253 | 713 | 12.29 | 175.02 | A0 DR P1 |
| 5011274 | 12-Jan-2005 | 14:22:00 | 14:26:50 | 14:28:28 | 388 | 30 | 47376 | 6-12 | -668 | 258 | 717 | 12.61 | 174.71 | A0 |
| 50112107 | 12-Jan-2005 | 14:28:28 | 14:30:10 | 14:34:24 | 356 | 26 | 40776 | 6-12 | -643 | 282 | 702 | 14.01 | 176.51 | A0 |
| 5011211 | 12-Jan-2005 | 14:39:52 | 14:40:46 | 14:45:32 | 340 | 128 | 84624 | 12-25 | -644 | 276 | 700 | 13.63 | 176.41 | A0 DR P1 |
| 5011275 | 12-Jan-2005 | 14:46:56 | 14:49:50 | 14:53:44 | 408 | 92 | 120720 | 6-12 | -648 | 281 | 706 | 13.97 | 175.91 | A0 DR P1 |
| 5011212 | 12-Jan-2005 | 15:00:28 | 15:01:10 | 15:03:08 | 160 | 55 | 25135 | 6-12 | -626 | 288 | 690 | 14.31 | 177.58 | A0 DF P1 |
| Date | Start | Peak | End | Classification | B [deg] | LCM [deg] |
|---|---|---|---|---|---|---|
| 12-Jan-2005 | 13:59 | 14:06 | 14:10 | B4.1 | 12 | -44 |

