
move the mouse pointer over that image.
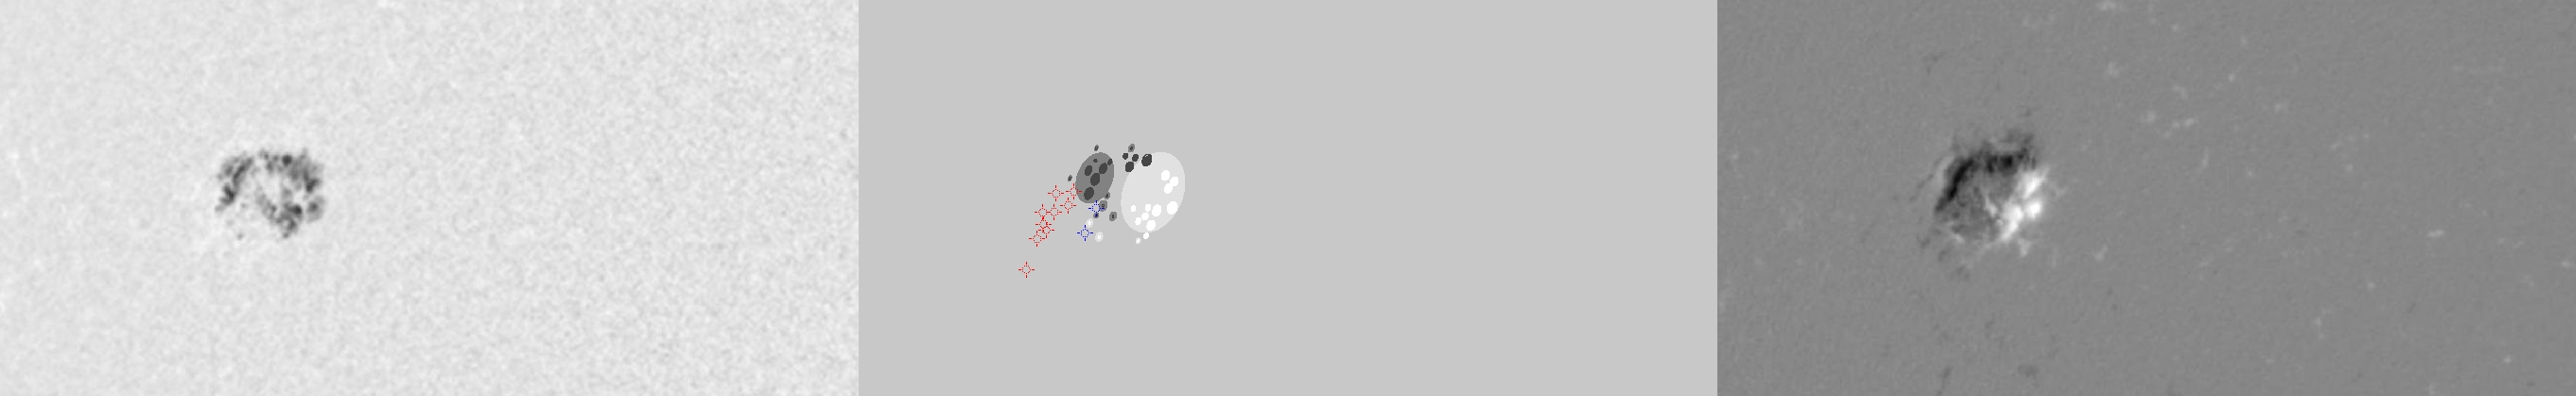
| Evolution of sunspot group NOAA 10720 and positions of flares in it animated by using the data of SOHO/MDI Debrecen Data (SDD) sunspot catalogue (lower panel, middle, ellipses with positions and areas corresponding to the relevant data of spots in SDD and with grey-scale colour coding of the magnetic polarities corresponding to that of the magnetograms), SOHO/MDI continuum images (lower panel, left) and magnetograms (lower panel, right), SOHO/EIT images (upper panel, middle), GOES and RHESSI flare data (red and blue symbols) observed within the interval around the time of SDD data. |
|
When you want to zoom in on one of the images, simply move the mouse pointer over that image. |
 |
| Year | Month | Day | Hour | Min | Sec | NOAA | Proj.U | Proj.WS | Corr.U | Corr.WS | B | L | LCM | Pos.angle | r | MU | MP |
|---|---|---|---|---|---|---|---|---|---|---|---|---|---|---|---|---|---|
| 2005 | 01 | 12 | 11 | 03 | 32 | 10720 | 150 | 844 | 106 | 609 | 13.58 | 179.33 | -43.40 | 66.76 | 0.7289 | -49.3 | -117.0 |
| Flare | Date | Start | Peak | End | Dur [s] | Peak [c/s] | Total Counts | Energy [keV] | X pos [asec] | Y pos [asec] | Radial [asec] | B [deg] | L [deg] | Flags |
|---|---|---|---|---|---|---|---|---|---|---|---|---|---|---|
| 5011260 | 12-Jan-2005 | 08:47:32 | 08:54:50 | 08:55:44 | 492 | 256 | 358440 | 6-12 | -723 | 242 | 763 | 11.91 | 172.91 | A0 |
| 5011227 | 12-Jan-2005 | 09:24:28 | 09:25:22 | 09:28:04 | 216 | 36 | 31152 | 6-12 | -697 | 265 | 746 | 13.21 | 174.73 | A0 P1 PE |
| 5011228 | 12-Jan-2005 | 09:50:00 | 09:51:22 | 09:54:32 | 272 | 112 | 77040 | 6-12 | -701 | 261 | 748 | 12.98 | 174.18 | A0 |
| 50112102 | 12-Jan-2005 | 09:54:32 | 09:58:34 | 10:04:24 | 592 | 384 | 449712 | 12-25 | -705 | 249 | 748 | 12.25 | 173.93 | A0 |
| 5011206 | 12-Jan-2005 | 10:04:24 | 10:06:34 | 10:11:12 | 408 | 44 | 70464 | 6-12 | -705 | 253 | 749 | 12.50 | 173.80 | A0 |
| 5011262 | 12-Jan-2005 | 10:15:32 | 10:19:34 | 10:21:52 | 380 | 40 | 50640 | 6-12 | -703 | 261 | 749 | 12.99 | 173.74 | A0 |
| 50112103 | 12-Jan-2005 | 10:26:04 | 10:26:14 | 10:27:08 | 64 | 22 | 6888 | 6-12 | -681 | 275 | 735 | 13.76 | 175.48 | A0 |
| 5011263 | 12-Jan-2005 | 10:28:28 | 10:30:54 | 10:31:28 | 180 | 32 | 27144 | 6-12 | -692 | 274 | 744 | 13.75 | 174.44 | A0 |
| 5011229 | 12-Jan-2005 | 11:00:08 | 11:09:42 | 11:09:52 | 584 | 38 | 67296 | 6-12 | -704 | 224 | 739 | 10.68 | 173.73 | A0 P1 PE |
| Date | Start | Peak | End | Classification | B [deg] | LCM [deg] |
|---|---|---|---|---|---|---|
| 12-Jan-2005 | 08:53 | 08:58 | 09:01 | B6.2 | 12 | -47 |
| 12-Jan-2005 | 09:55 | 09:59 | 10:03 | B4.1 | 13 | -46 |

