move the mouse pointer over that image.
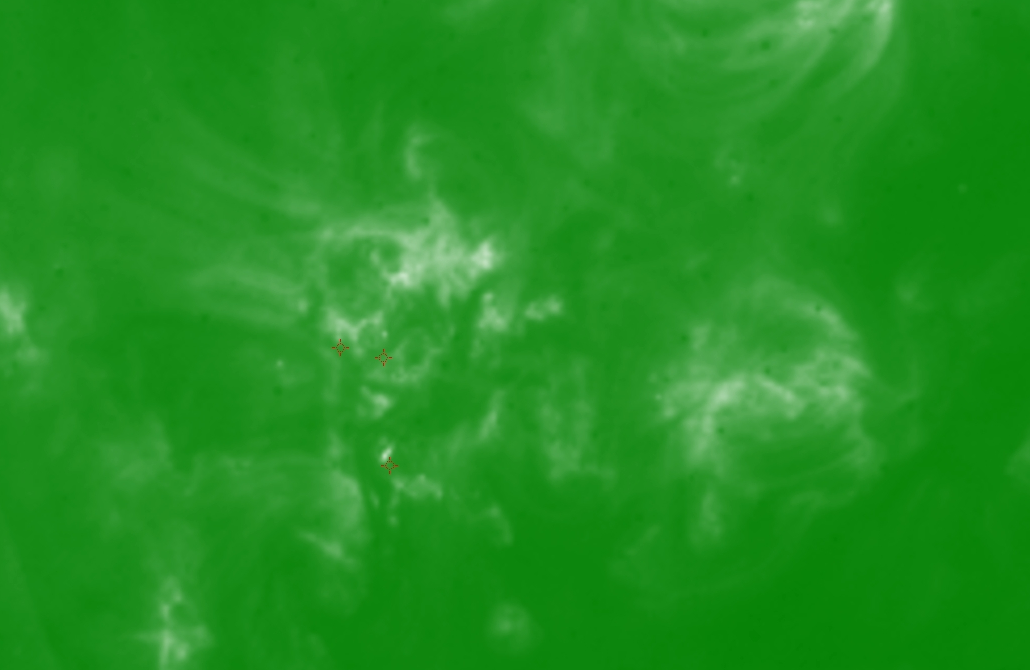
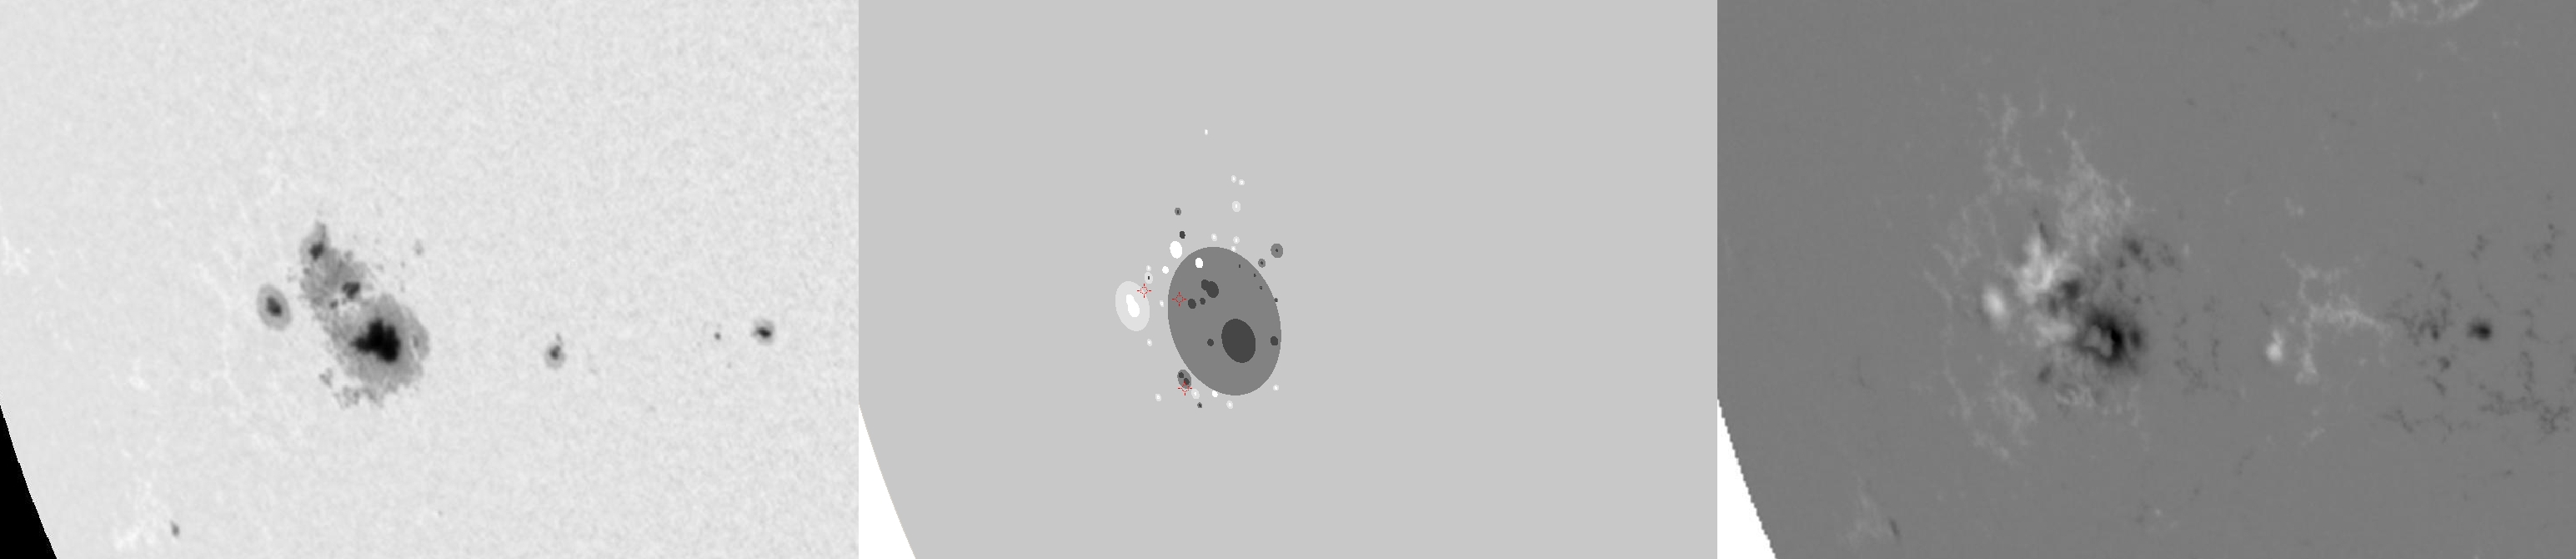
| Evolution of sunspot group NOAA 10069 and positions of flares in it animated by using the data of SOHO/MDI Debrecen Data (SDD) sunspot catalogue (lower panel, middle, ellipses with positions and areas corresponding to the relevant data of spots in SDD and with grey-scale colour coding of the magnetic polarities corresponding to that of the magnetograms), SOHO/MDI continuum images (lower panel, left) and magnetograms (lower panel, right), SOHO/EIT images (upper panel, middle), GOES and RHESSI flare data (red and blue symbols) observed within the interval around the time of SDD data. |
|
When you want to zoom in on one of the images, simply move the mouse pointer over that image. |
 |
| Year | Month | Day | Hour | Min | Sec | NOAA | Proj.U | Proj.WS | Corr.U | Corr.WS | B | L | LCM | Pos.angle | r | MU | MP |
|---|---|---|---|---|---|---|---|---|---|---|---|---|---|---|---|---|---|
| 2002 | 08 | 14 | 11 | 11 | 32 | 10069 | 377 | 2921 | 265 | 2063 | -7.68 | 299.27 | -43.22 | 107.69 | 0.7144 | -578.6 | -93.5 |
| Flare | Date | Start | Peak | End | Dur [s] | Peak [c/s] | Total Counts | Energy [keV] | X pos [asec] | Y pos [asec] | Radial [asec] | B [deg] | L [deg] | Flags |
|---|---|---|---|---|---|---|---|---|---|---|---|---|---|---|
| 2081426 | 14-Aug-2002 | 10:56:24 | 11:00:46 | 11:05:48 | 564 | 560 | 696048 | 12-25 | -667 | -261 | 717 | -11.15 | 296.91 | A0 |
| 20814134 | 14-Aug-2002 | 11:05:48 | 11:05:50 | 11:10:16 | 268 | 104 | 118944 | 6-12 | -670 | -194 | 698 | -6.99 | 297.27 | A0 |
| 20814107 | 14-Aug-2002 | 11:52:00 | 11:52:34 | 11:58:36 | 396 | 480 | 275232 | 6-12 | -687 | -189 | 712 | -6.80 | 295.41 | A0 ES P1 |
| Date | Start | Peak | End | Classification | B [deg] | LCM [deg] |
|---|---|---|---|---|---|---|
| No data |

