move the mouse pointer over that image.
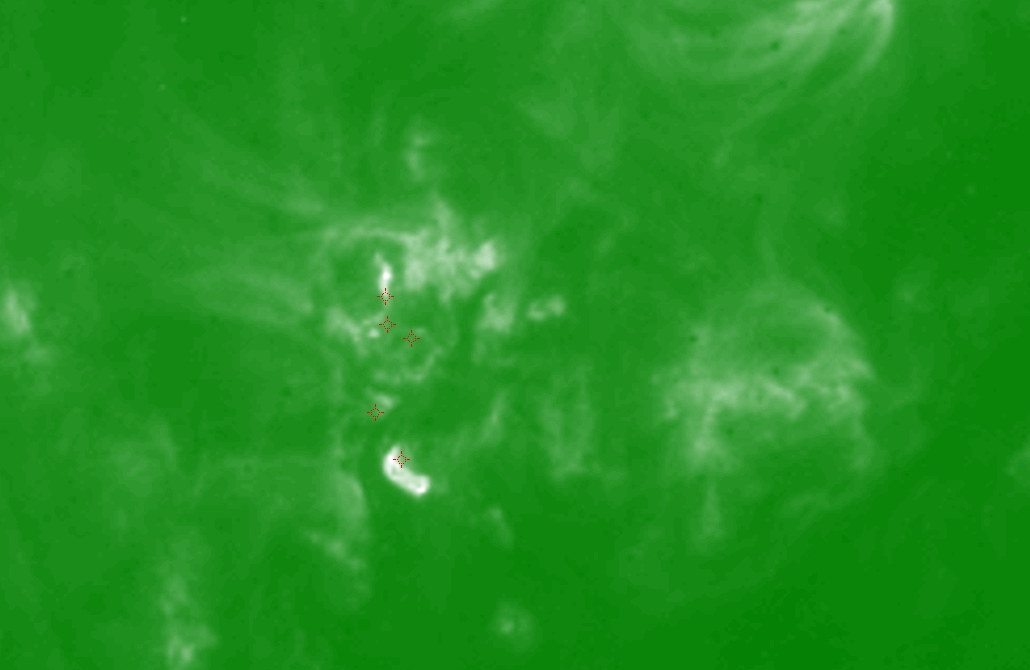
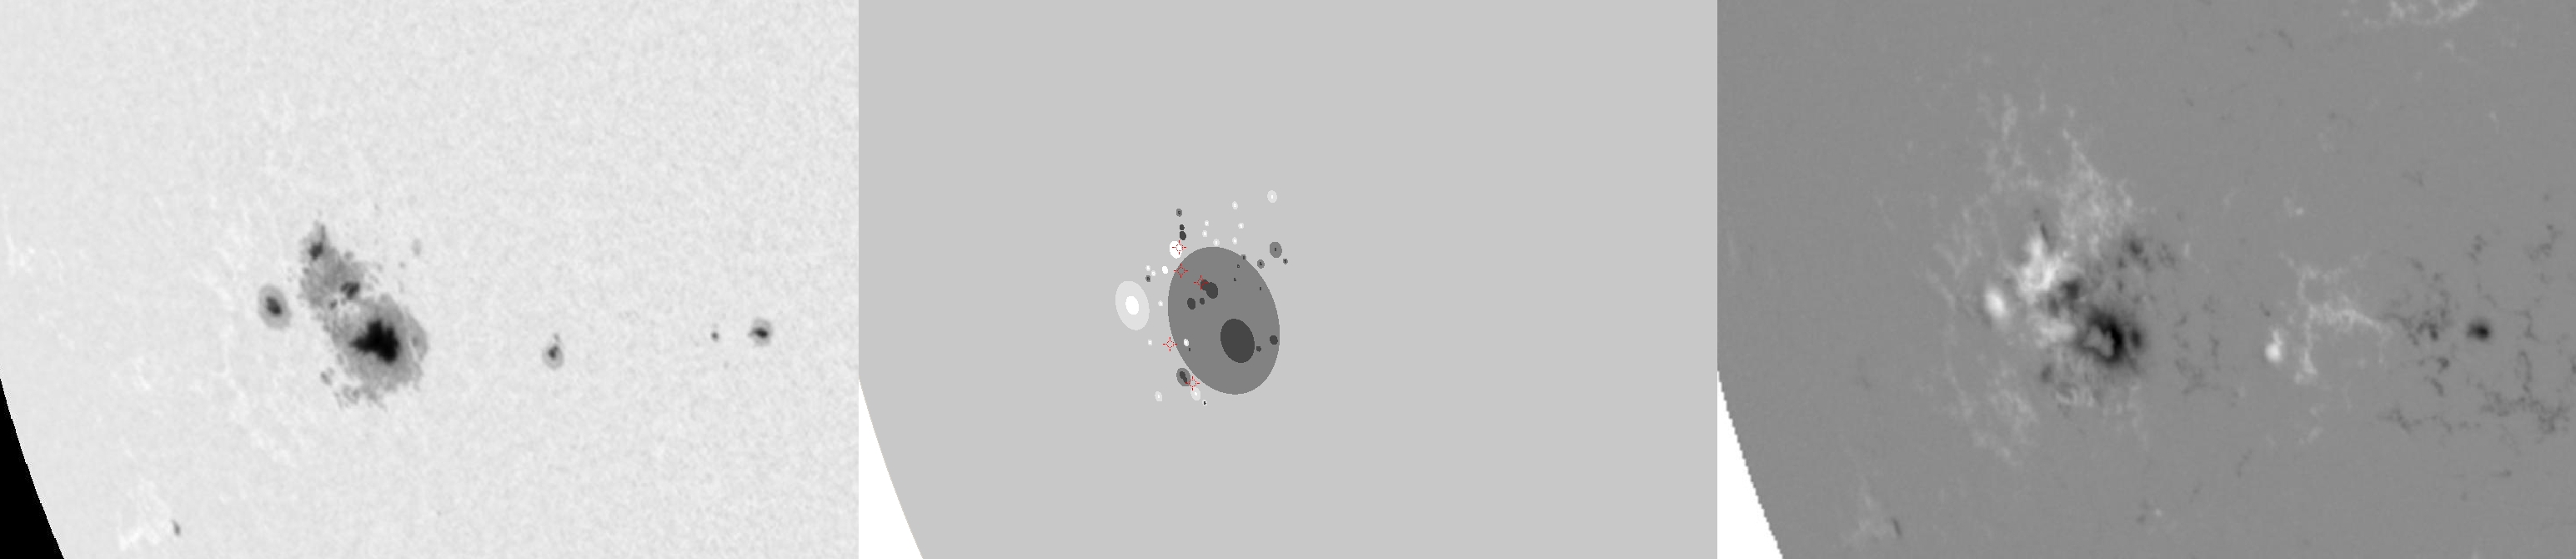
| Evolution of sunspot group NOAA 10069 and positions of flares in it animated by using the data of SOHO/MDI Debrecen Data (SDD) sunspot catalogue (lower panel, middle, ellipses with positions and areas corresponding to the relevant data of spots in SDD and with grey-scale colour coding of the magnetic polarities corresponding to that of the magnetograms), SOHO/MDI continuum images (lower panel, left) and magnetograms (lower panel, right), SOHO/EIT images (upper panel, middle), GOES and RHESSI flare data (red and blue symbols) observed within the interval around the time of SDD data. |
|
When you want to zoom in on one of the images, simply move the mouse pointer over that image. |
 |
| Year | Month | Day | Hour | Min | Sec | NOAA | Proj.U | Proj.WS | Corr.U | Corr.WS | B | L | LCM | Pos.angle | r | MU | MP |
|---|---|---|---|---|---|---|---|---|---|---|---|---|---|---|---|---|---|
| 2002 | 08 | 14 | 10 | 17 | 32 | 10069 | 364 | 2895 | 261 | 2059 | -7.63 | 299.29 | -43.69 | 107.44 | 0.7197 | -612.6 | -85.4 |
| Flare | Date | Start | Peak | End | Dur [s] | Peak [c/s] | Total Counts | Energy [keV] | X pos [asec] | Y pos [asec] | Radial [asec] | B [deg] | L [deg] | Flags |
|---|---|---|---|---|---|---|---|---|---|---|---|---|---|---|
| 20814102 | 14-Aug-2002 | 09:16:00 | 09:17:22 | 09:37:20 | 1280 | 12 | 33115 | 12-25 | -694 | -226 | 730 | -9.16 | 295.87 | A0 P1 PE |
| 2081483 | 14-Aug-2002 | 09:38:04 | 09:38:38 | 09:39:52 | 108 | 2 | 767 | 12-25 | -667 | -180 | 691 | -6.11 | 298.43 | A0 |
| 2081424 | 14-Aug-2002 | 10:15:40 | 10:16:30 | 10:17:56 | 136 | 1008 | 487632 | 6-12 | -665 | -257 | 713 | -10.88 | 297.54 | A0 ES P1 |
| 20814132 | 14-Aug-2002 | 10:17:56 | 10:21:10 | 10:31:44 | 828 | 1328 | 2656896 | 12-25 | -674 | -155 | 692 | -4.63 | 297.59 | A0 GD GE P1 PE |
| 20814133 | 14-Aug-2002 | 10:37:28 | 10:38:02 | 10:40:16 | 168 | 52 | 45504 | 6-12 | -669 | -173 | 691 | -5.70 | 297.76 | A0 |
| Date | Start | Peak | End | Classification | B [deg] | LCM [deg] |
|---|---|---|---|---|---|---|
| No data |

