move the mouse pointer over that image.
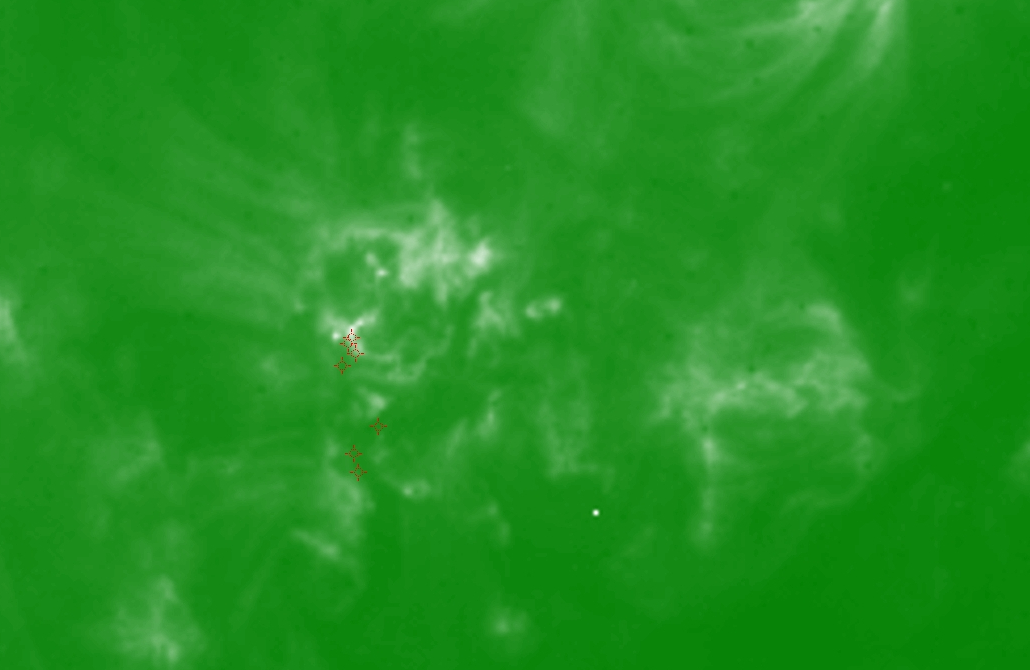
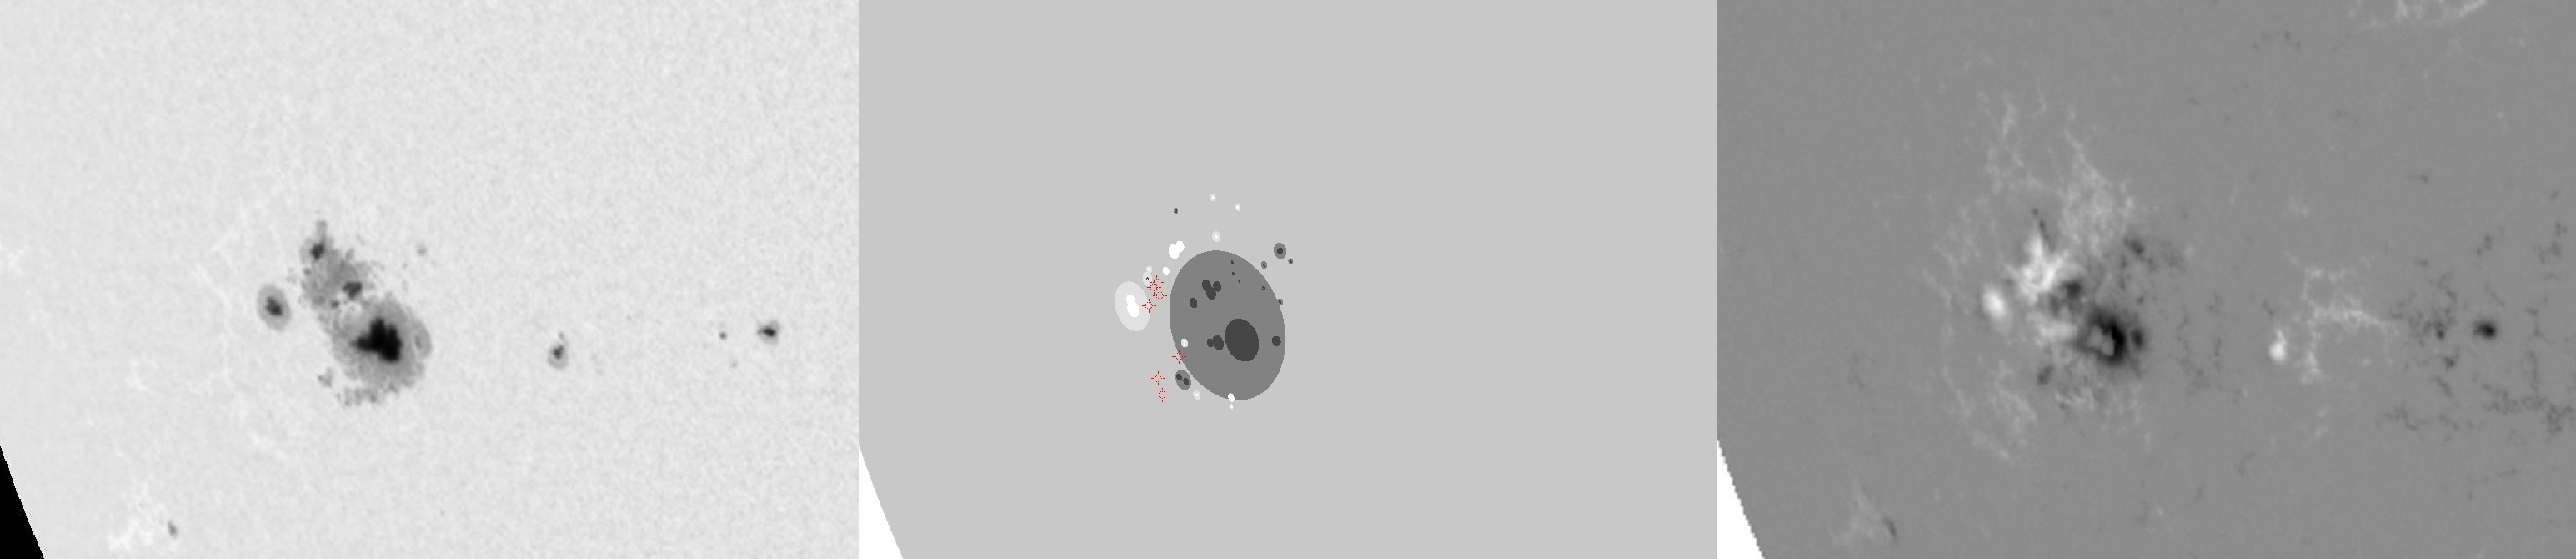
| Evolution of sunspot group NOAA 10069 and positions of flares in it animated by using the data of SOHO/MDI Debrecen Data (SDD) sunspot catalogue (lower panel, middle, ellipses with positions and areas corresponding to the relevant data of spots in SDD and with grey-scale colour coding of the magnetic polarities corresponding to that of the magnetograms), SOHO/MDI continuum images (lower panel, left) and magnetograms (lower panel, right), SOHO/EIT images (upper panel, middle), GOES and RHESSI flare data (red and blue symbols) observed within the interval around the time of SDD data. |
|
When you want to zoom in on one of the images, simply move the mouse pointer over that image. |
 |
| Year | Month | Day | Hour | Min | Sec | NOAA | Proj.U | Proj.WS | Corr.U | Corr.WS | B | L | LCM | Pos.angle | r | MU | MP |
|---|---|---|---|---|---|---|---|---|---|---|---|---|---|---|---|---|---|
| 2002 | 08 | 14 | 12 | 47 | 32 | 10069 | 390 | 3015 | 272 | 2097 | -7.84 | 299.37 | -42.24 | 108.33 | 0.7036 | -612.4 | -86.3 |
| Flare | Date | Start | Peak | End | Dur [s] | Peak [c/s] | Total Counts | Energy [keV] | X pos [asec] | Y pos [asec] | Radial [asec] | B [deg] | L [deg] | Flags |
|---|---|---|---|---|---|---|---|---|---|---|---|---|---|---|
| 2081439 | 14-Aug-2002 | 12:44:20 | 12:51:06 | 12:53:00 | 520 | 656 | 813672 | 12-25 | -673 | -193 | 701 | -6.95 | 296.06 | A0 P1 PE |
| 20814109 | 14-Aug-2002 | 13:28:24 | 13:28:50 | 13:35:12 | 408 | 52 | 59448 | 6-12 | -667 | -184 | 692 | -6.35 | 296.29 | A0 |
| 20814136 | 14-Aug-2002 | 13:35:12 | 13:36:58 | 13:38:48 | 216 | 24 | 25512 | 6-12 | -648 | -240 | 691 | -9.69 | 297.34 | A0 P1 PE |
| 20814112 | 14-Aug-2002 | 14:24:24 | 14:25:26 | 14:29:16 | 292 | 256 | 210960 | 6-12 | -657 | -189 | 684 | -6.59 | 296.58 | A0 GS P1 |
| 2081470 | 14-Aug-2002 | 15:04:56 | 15:06:06 | 15:09:08 | 252 | 60 | 63384 | 6-12 | -652 | -204 | 684 | -7.48 | 296.51 | A0 P1 PE |
| 20814137 | 14-Aug-2002 | 15:09:08 | 15:11:26 | 15:14:32 | 324 | 152 | 123744 | 12-25 | -641 | -271 | 696 | -11.59 | 296.72 | A0 P1 PE |
| 20814113 | 14-Aug-2002 | 15:14:32 | 15:16:26 | 15:20:12 | 340 | 108 | 89328 | 6-12 | -643 | -259 | 693 | -10.85 | 296.65 | A0 P1 PE |
| Date | Start | Peak | End | Classification | B [deg] | LCM [deg] |
|---|---|---|---|---|---|---|
| No data |

