move the mouse pointer over that image.
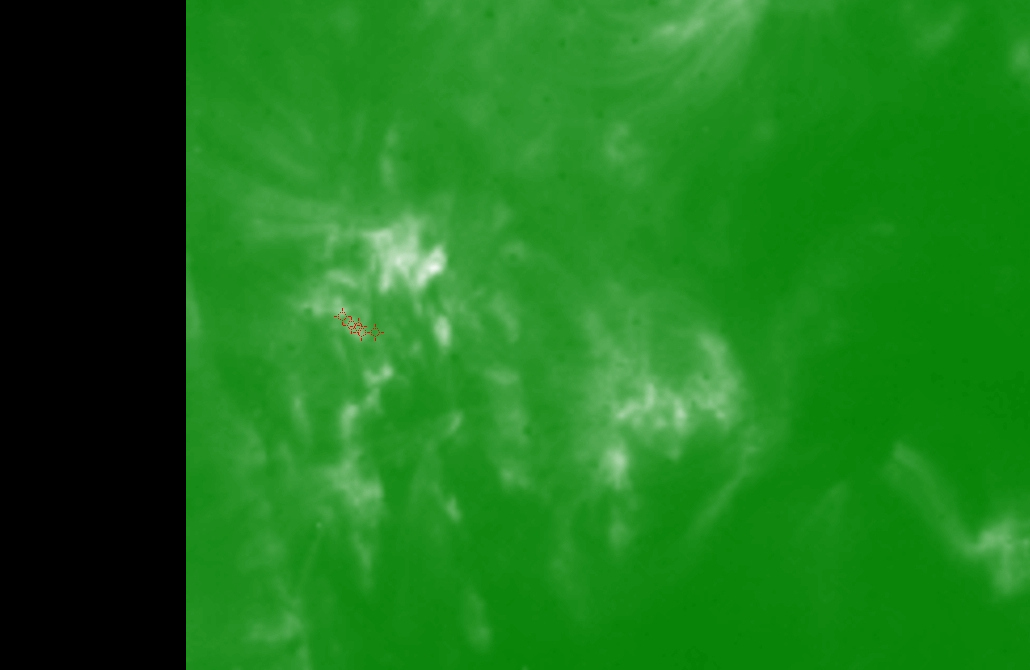
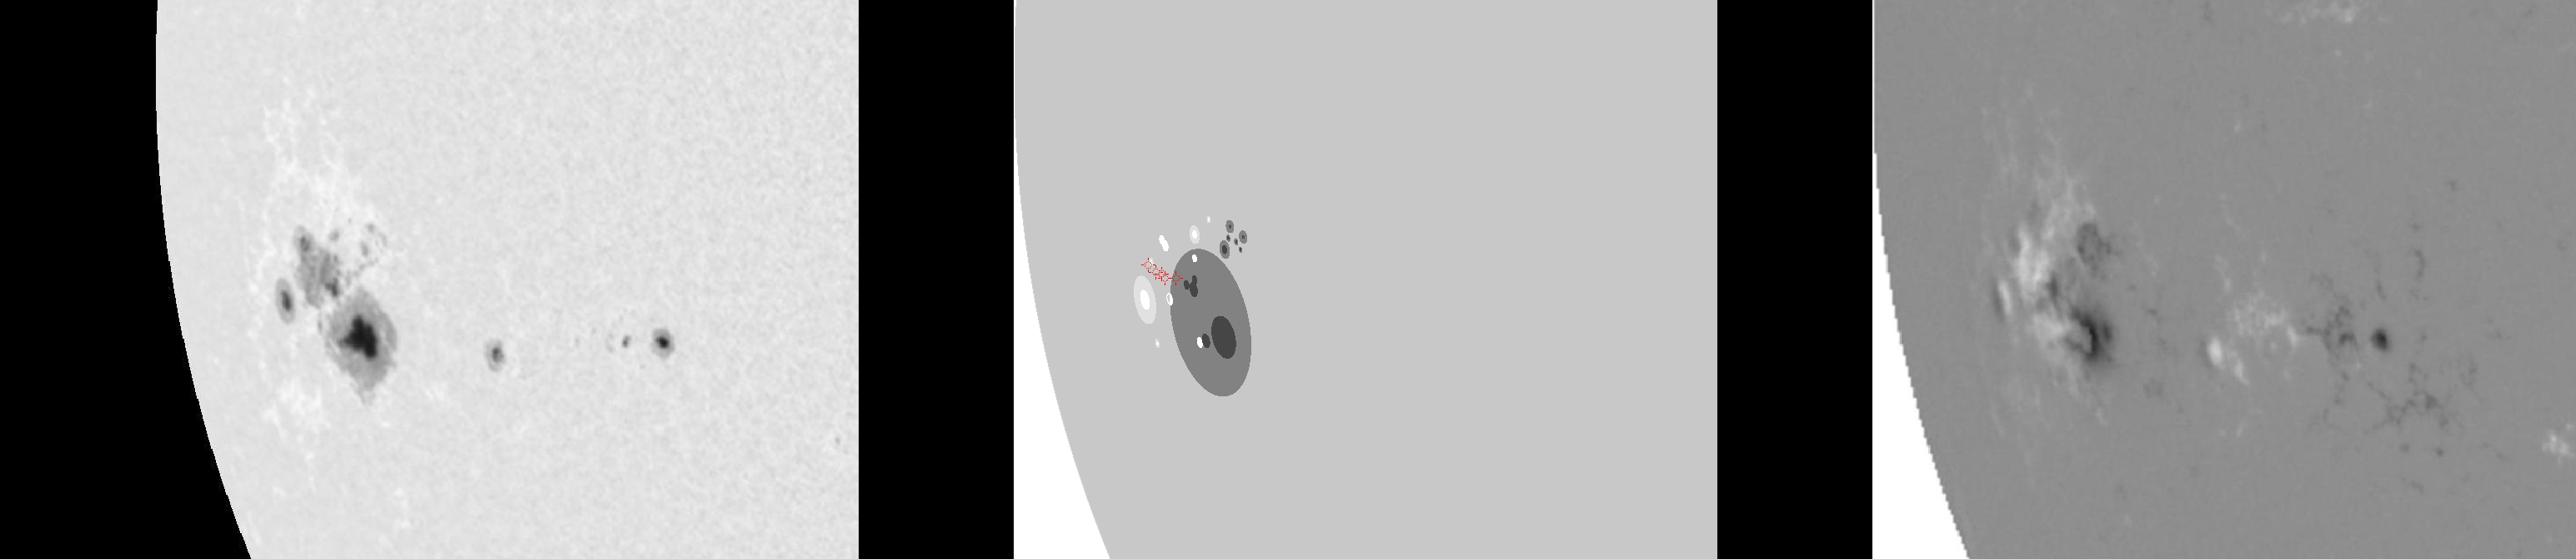
| Evolution of sunspot group NOAA 10069 and positions of flares in it animated by using the data of SOHO/MDI Debrecen Data (SDD) sunspot catalogue (lower panel, middle, ellipses with positions and areas corresponding to the relevant data of spots in SDD and with grey-scale colour coding of the magnetic polarities corresponding to that of the magnetograms), SOHO/MDI continuum images (lower panel, left) and magnetograms (lower panel, right), SOHO/EIT images (upper panel, middle), GOES and RHESSI flare data (red and blue symbols) observed within the interval around the time of SDD data. |
|
When you want to zoom in on one of the images, simply move the mouse pointer over that image. |
 |
| Year | Month | Day | Hour | Min | Sec | NOAA | Proj.U | Proj.WS | Corr.U | Corr.WS | B | L | LCM | Pos.angle | r | MU | MP |
|---|---|---|---|---|---|---|---|---|---|---|---|---|---|---|---|---|---|
| 2002 | 08 | 13 | 06 | 23 | 32 | 10069 | 250 | 1960 | 254 | 1981 | -7.69 | 299.31 | -59.04 | 102.70 | 0.8725 | -318.9 | -7.0 |
| Flare | Date | Start | Peak | End | Dur [s] | Peak [c/s] | Total Counts | Energy [keV] | X pos [asec] | Y pos [asec] | Radial [asec] | B [deg] | L [deg] | Flags |
|---|---|---|---|---|---|---|---|---|---|---|---|---|---|---|
| 20813127 | 13-Aug-2002 | 05:25:08 | 05:39:54 | 05:44:00 | 1132 | 1200 | 1369440 | 12-25 | -835 | -155 | 850 | -6.16 | 297.13 | A0 P1 PE |
| 2081309 | 13-Aug-2002 | 06:02:24 | 06:06:46 | 06:12:48 | 624 | 184 | 485952 | 6-12 | -852 | -146 | 864 | -5.83 | 294.77 | A0 |
| 2081372 | 13-Aug-2002 | 06:12:48 | 06:16:54 | 06:22:08 | 560 | 288 | 384600 | 12-25 | -838 | -156 | 852 | -6.26 | 296.40 | A0 |
| 20813103 | 13-Aug-2002 | 06:58:28 | 06:59:10 | 07:00:28 | 120 | 68 | 30192 | 6-12 | -834 | -154 | 848 | -6.09 | 296.54 | A0 |
| 20813128 | 13-Aug-2002 | 07:00:28 | 07:03:26 | 07:03:56 | 208 | 76 | 70176 | 6-12 | -838 | -153 | 852 | -6.08 | 296.01 | A0 |
| Date | Start | Peak | End | Classification | B [deg] | LCM [deg] |
|---|---|---|---|---|---|---|
| No data |

