move the mouse pointer over that image.
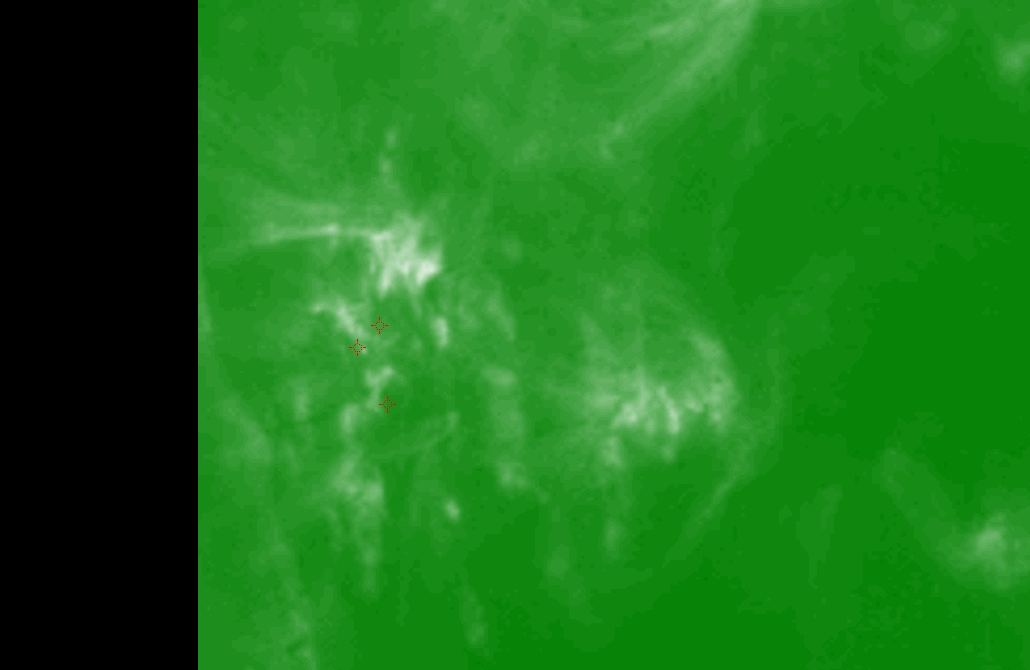
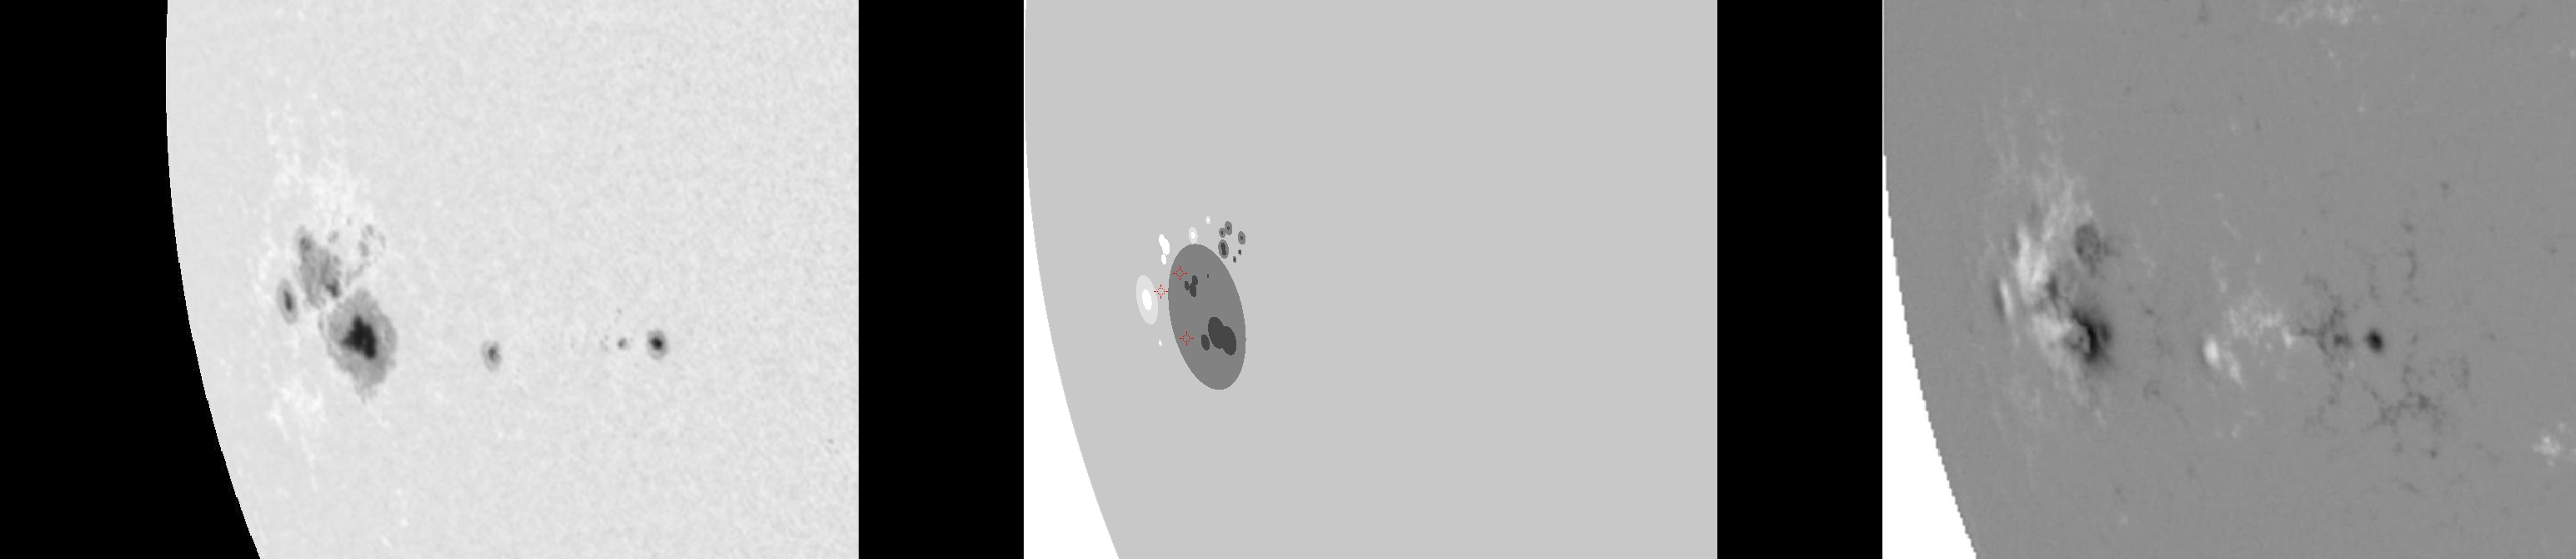
| Evolution of sunspot group NOAA 10069 and positions of flares in it animated by using the data of SOHO/MDI Debrecen Data (SDD) sunspot catalogue (lower panel, middle, ellipses with positions and areas corresponding to the relevant data of spots in SDD and with grey-scale colour coding of the magnetic polarities corresponding to that of the magnetograms), SOHO/MDI continuum images (lower panel, left) and magnetograms (lower panel, right), SOHO/EIT images (upper panel, middle), GOES and RHESSI flare data (red and blue symbols) observed within the interval around the time of SDD data. |
|
When you want to zoom in on one of the images, simply move the mouse pointer over that image. |
 |
| Year | Month | Day | Hour | Min | Sec | NOAA | Proj.U | Proj.WS | Corr.U | Corr.WS | B | L | LCM | Pos.angle | r | MU | MP |
|---|---|---|---|---|---|---|---|---|---|---|---|---|---|---|---|---|---|
| 2002 | 08 | 13 | 04 | 47 | 32 | 10069 | 246 | 1903 | 259 | 1983 | -7.40 | 299.12 | -60.12 | 102.13 | 0.8808 | -268.6 | -12.7 |
| Flare | Date | Start | Peak | End | Dur [s] | Peak [c/s] | Total Counts | Energy [keV] | X pos [asec] | Y pos [asec] | Radial [asec] | B [deg] | L [deg] | Flags |
|---|---|---|---|---|---|---|---|---|---|---|---|---|---|---|
| 20813126 | 13-Aug-2002 | 03:55:36 | 04:01:10 | 04:25:44 | 1808 | 1520 | 3847680 | 12-25 | -840 | -149 | 853 | -5.86 | 297.47 | A0 |
| 2081305 | 13-Aug-2002 | 04:25:44 | 04:28:22 | 04:33:52 | 488 | 176 | 200976 | 12-25 | -831 | -199 | 854 | -8.86 | 297.64 | A0 |
| 20813101 | 13-Aug-2002 | 04:35:04 | 04:35:34 | 04:38:44 | 220 | 36 | 34752 | 6-12 | -849 | -164 | 865 | -6.91 | 295.76 | A0 |
| Date | Start | Peak | End | Classification | B [deg] | LCM [deg] |
|---|---|---|---|---|---|---|
| No data |

