move the mouse pointer over that image.
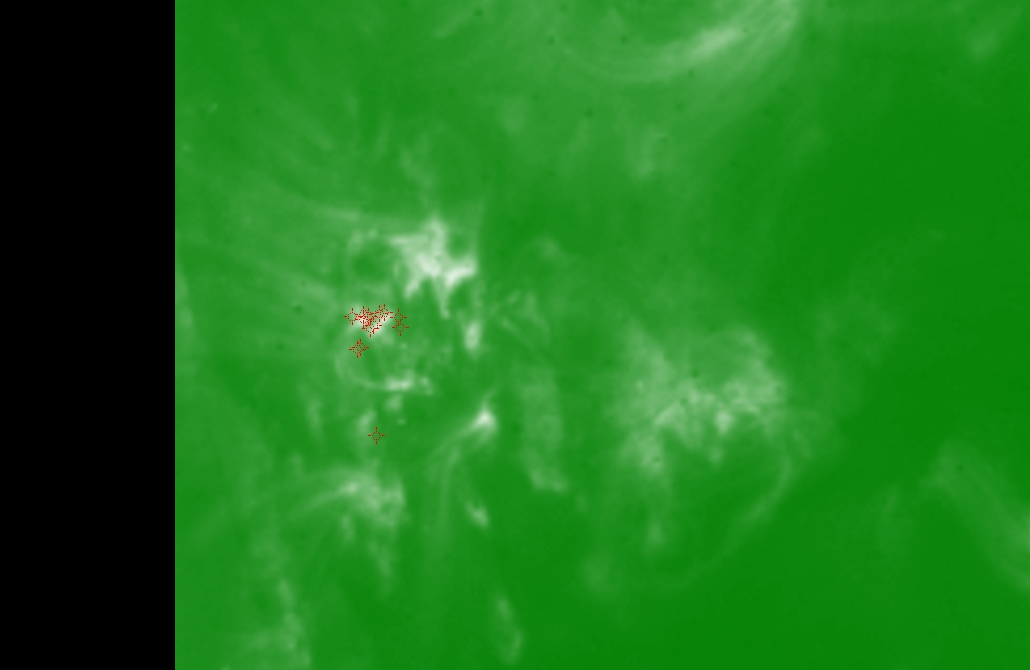
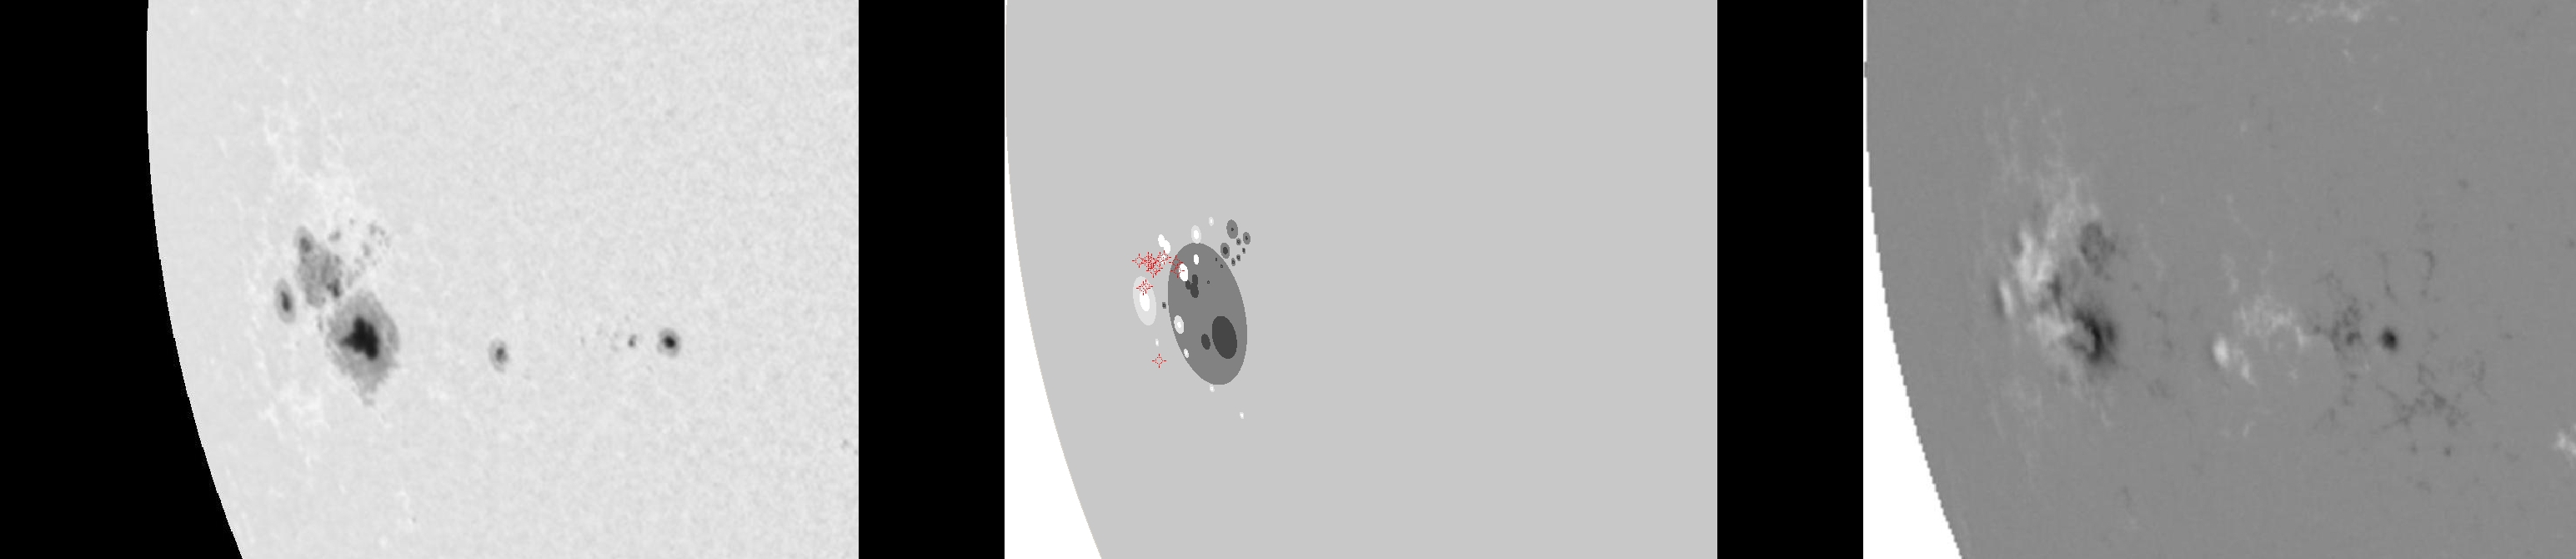
| Evolution of sunspot group NOAA 10069 and positions of flares in it animated by using the data of SOHO/MDI Debrecen Data (SDD) sunspot catalogue (lower panel, middle, ellipses with positions and areas corresponding to the relevant data of spots in SDD and with grey-scale colour coding of the magnetic polarities corresponding to that of the magnetograms), SOHO/MDI continuum images (lower panel, left) and magnetograms (lower panel, right), SOHO/EIT images (upper panel, middle), GOES and RHESSI flare data (red and blue symbols) observed within the interval around the time of SDD data. |
|
When you want to zoom in on one of the images, simply move the mouse pointer over that image. |
 |
| Year | Month | Day | Hour | Min | Sec | NOAA | Proj.U | Proj.WS | Corr.U | Corr.WS | B | L | LCM | Pos.angle | r | MU | MP |
|---|---|---|---|---|---|---|---|---|---|---|---|---|---|---|---|---|---|
| 2002 | 08 | 13 | 07 | 59 | 32 | 10069 | 287 | 1965 | 284 | 1944 | -7.32 | 299.07 | -58.41 | 102.44 | 0.8666 | -204.6 | -27.4 |
| Flare | Date | Start | Peak | End | Dur [s] | Peak [c/s] | Total Counts | Energy [keV] | X pos [asec] | Y pos [asec] | Radial [asec] | B [deg] | L [deg] | Flags |
|---|---|---|---|---|---|---|---|---|---|---|---|---|---|---|
| 20813131 | 13-Aug-2002 | 07:35:40 | 07:36:14 | 07:37:16 | 96 | 60 | 24432 | 6-12 | -824 | -151 | 838 | -5.78 | 297.47 | A0 |
| 2081312 | 13-Aug-2002 | 07:38:44 | 07:41:38 | 07:44:32 | 348 | 432 | 230592 | 12-25 | -824 | -145 | 837 | -5.41 | 297.48 | A0 |
| 20813107 | 13-Aug-2002 | 08:34:24 | 08:35:02 | 08:41:40 | 436 | 3 | 4725 | 6-12 | -828 | -144 | 840 | -5.39 | 296.52 | A0 |
| 20813133 | 13-Aug-2002 | 08:41:40 | 08:46:18 | 08:54:04 | 744 | 3 | 6112 | 6-12 | -833 | -146 | 846 | -5.58 | 295.78 | A0 |
| 20813109 | 13-Aug-2002 | 08:56:00 | 08:56:50 | 08:58:16 | 136 | 1 | 645 | 6-12 | -828 | -152 | 842 | -5.89 | 296.23 | A0 |
| 20813134 | 13-Aug-2002 | 08:58:16 | 09:03:46 | 09:16:24 | 1088 | 9 | 20931 | 12-25 | -829 | -154 | 844 | -6.02 | 296.02 | A0 |
| 2081375 | 13-Aug-2002 | 10:10:44 | 10:11:18 | 10:14:44 | 240 | 136 | 126936 | 6-12 | -825 | -168 | 842 | -6.84 | 295.72 | A0 P1 PE |
| 20813135 | 13-Aug-2002 | 10:14:44 | 10:24:06 | 10:33:24 | 1120 | 880 | 1560864 | 12-25 | -821 | -151 | 835 | -5.74 | 296.29 | A0 P1 PE |
| 20813111 | 13-Aug-2002 | 10:37:20 | 10:40:10 | 10:52:52 | 932 | 208 | 392736 | 12-25 | -805 | -147 | 819 | -5.31 | 298.04 | A0 |
| 2081319 | 13-Aug-2002 | 10:52:52 | 11:02:54 | 11:11:12 | 1100 | 224 | 710880 | 6-12 | -815 | -149 | 828 | -5.54 | 296.67 | A0 P1 PE |
| 2081368 | 13-Aug-2002 | 11:47:04 | 11:53:58 | 12:10:24 | 1400 | 216 | 690048 | 6-12 | -815 | -152 | 830 | -5.73 | 296.17 | A0 P1 PE |
| 20813112 | 13-Aug-2002 | 12:12:16 | 12:14:42 | 12:16:16 | 240 | 52 | 43440 | 6-12 | -796 | -227 | 827 | -10.20 | 297.13 | A0 |
| 20813136 | 13-Aug-2002 | 12:16:16 | 12:17:50 | 12:20:44 | 268 | 60 | 52416 | 6-12 | -808 | -173 | 826 | -6.95 | 296.53 | A0 |
| Date | Start | Peak | End | Classification | B [deg] | LCM [deg] |
|---|---|---|---|---|---|---|
| No data |

