move the mouse pointer over that image.
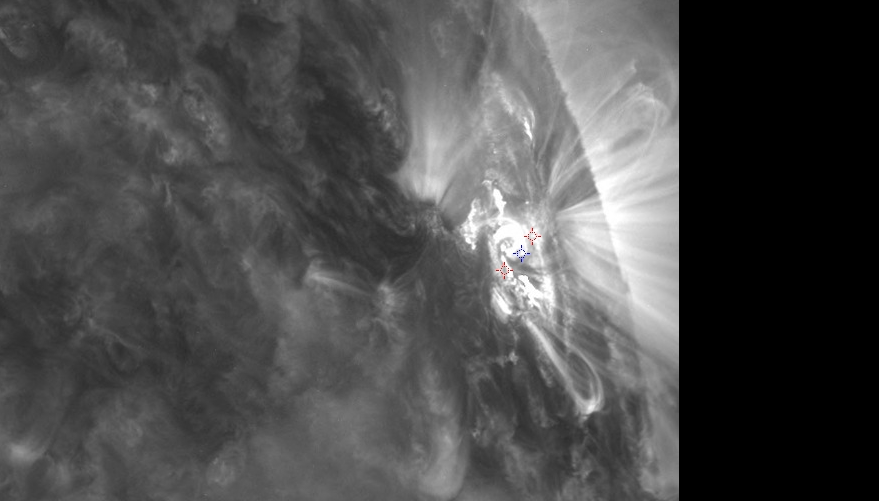
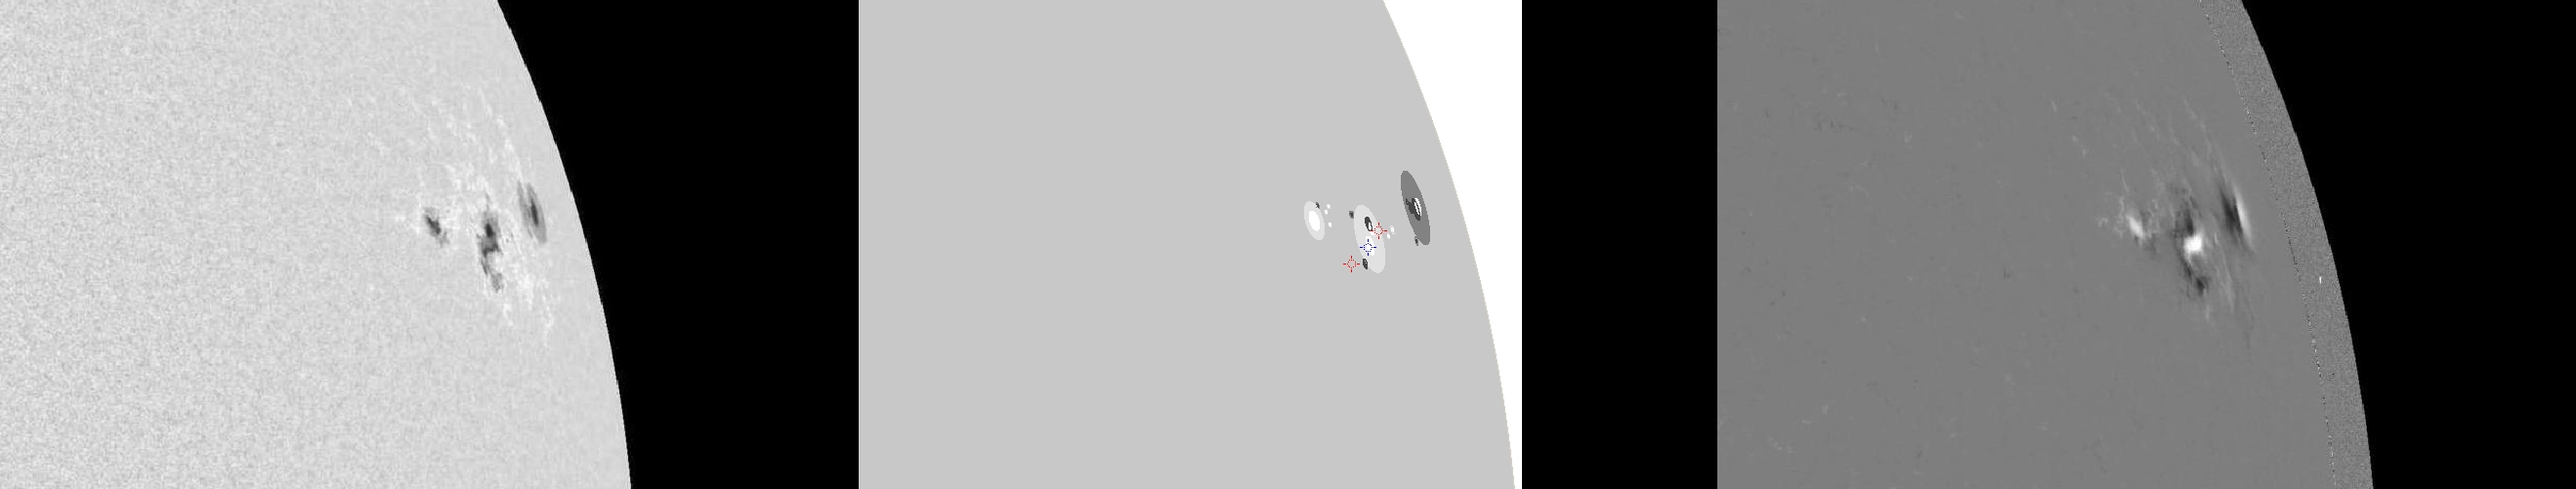
| Evolution of sunspot group NOAA 11263 and positions of flares in it animated by using the data of SDO/HMI Debrecen Data (HMIDD) sunspot catalogue (lower panel, middle, ellipses with positions and areas corresponding to the relevant data of spots in SDO and with grey-scale colour coding of the magnetic polarities corresponding to that of the magnetograms), SDO/HMI continuum images (lower panel, left) and magnetograms (lower panel, right), SDO/AIA images (upper panel, middle), GOES and RHESSI flare data (red and blue symbols) observed within the interval around the time of HMIDD data. |
|
When you want to zoom in on one of the images, simply move the mouse pointer over that image. |
 |
| Year | Month | Day | Hour | Min | Sec | NOAA | Proj.U | Proj.WS | Corr.U | Corr.WS | B | L | LCM | Pos.angle | r | MU | MP |
|---|---|---|---|---|---|---|---|---|---|---|---|---|---|---|---|---|---|
| 2011 | 08 | 09 | 07 | 59 | 11 | 11263 | 80 | 440 | 124 | 700 | 17.83 | 299.10 | 72.84 | 286.79 | 0.9486 | 109.6 | -19.1 |
| Flare | Date | Start | Peak | End | Dur [s] | Peak [c/s] | Total Counts | Energy [keV] | X pos [asec] | Y pos [asec] | Radial [asec] | B [deg] | L [deg] | Flags |
|---|---|---|---|---|---|---|---|---|---|---|---|---|---|---|
| 11080975 | 9-Aug-2011 | 07:34:44 | 07:36:22 | 07:37:24 | 160 | 4 | 2853 | 6-12 | 867 | 255 | 904 | 17.50 | 296.63 | A0 P1 Q1 |
| 11080927 | 9-Aug-2011 | 07:44:36 | 08:04:34 | 08:22:12 | 2256 | 53158 | 73353352 | 25-50 | 854 | 235 | 886 | 16.58 | 293.24 | a0 a1 A3 DR EE P1 PE |
| Date | Start | Peak | End | Classification | B [deg] | LCM [deg] |
|---|---|---|---|---|---|---|
| 9-Aug-2011 | 07:48 | 08:05 | 08:08 | X6.9 | 17 | 69 |

