move the mouse pointer over that image.
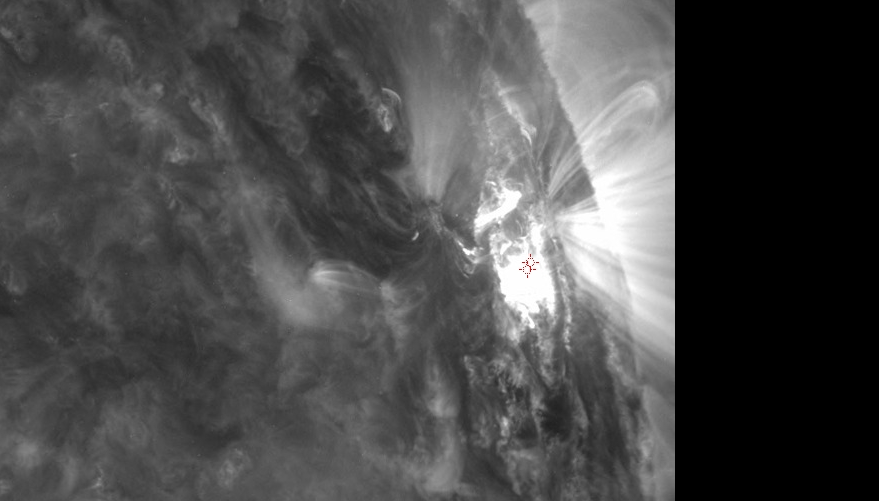
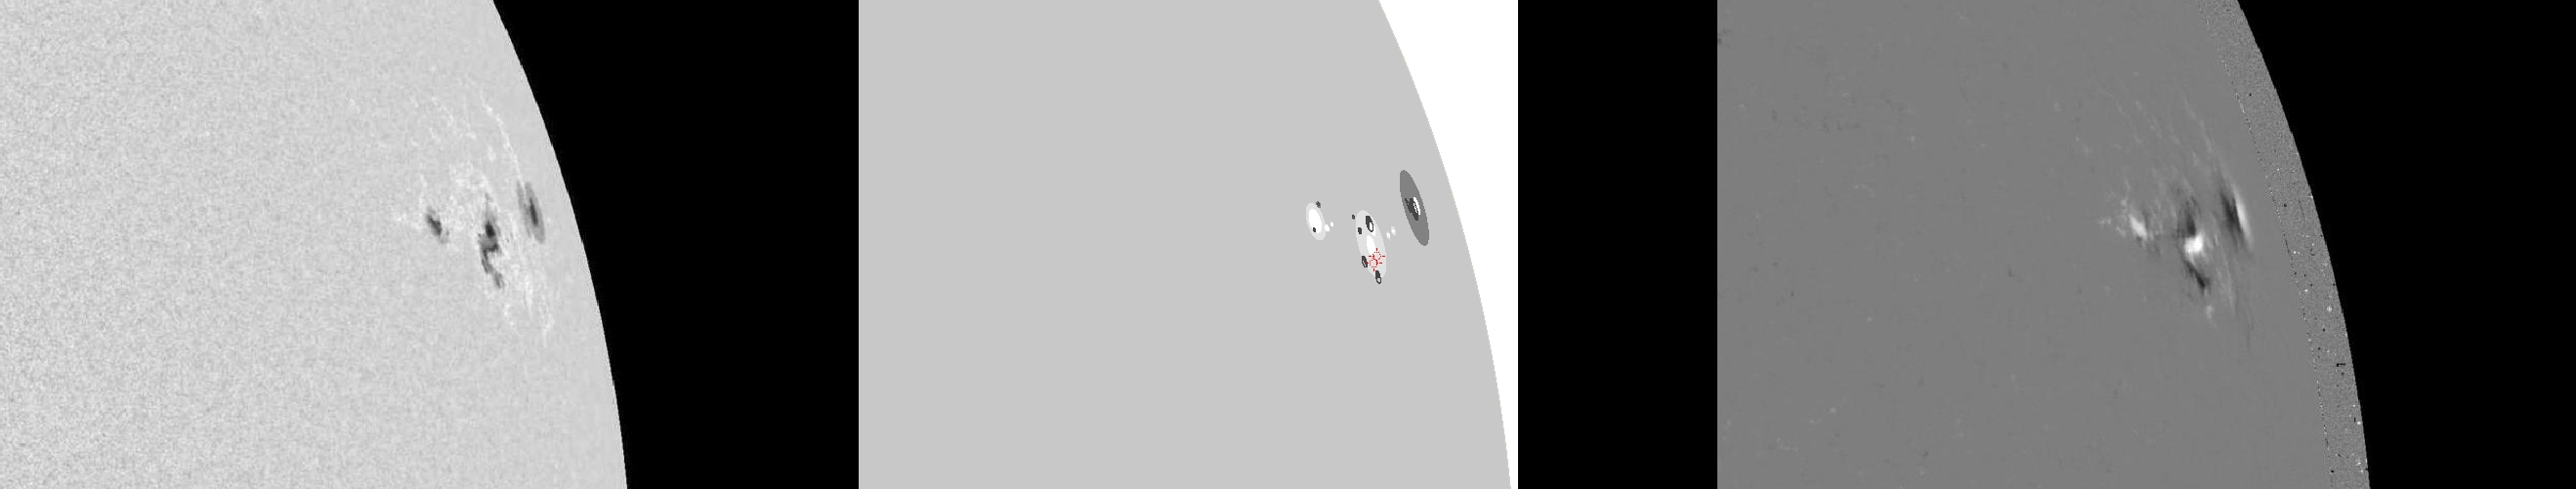
| Evolution of sunspot group NOAA 11263 and positions of flares in it animated by using the data of SDO/HMI Debrecen Data (HMIDD) sunspot catalogue (lower panel, middle, ellipses with positions and areas corresponding to the relevant data of spots in SDO and with grey-scale colour coding of the magnetic polarities corresponding to that of the magnetograms), SDO/HMI continuum images (lower panel, left) and magnetograms (lower panel, right), SDO/AIA images (upper panel, middle), GOES and RHESSI flare data (red and blue symbols) observed within the interval around the time of HMIDD data. |
|
When you want to zoom in on one of the images, simply move the mouse pointer over that image. |
 |
| Year | Month | Day | Hour | Min | Sec | NOAA | Proj.U | Proj.WS | Corr.U | Corr.WS | B | L | LCM | Pos.angle | r | MU | MP |
|---|---|---|---|---|---|---|---|---|---|---|---|---|---|---|---|---|---|
| 2011 | 08 | 09 | 08 | 59 | 11 | 11263 | 98 | 425 | 150 | 695 | 17.73 | 299.12 | 73.41 | 286.69 | 0.9515 | 82.0 | -6.9 |
| Flare | Date | Start | Peak | End | Dur [s] | Peak [c/s] | Total Counts | Energy [keV] | X pos [asec] | Y pos [asec] | Radial [asec] | B [deg] | L [deg] | Flags |
|---|---|---|---|---|---|---|---|---|---|---|---|---|---|---|
| 11080930 | 9-Aug-2011 | 08:48:56 | 08:49:42 | 09:00:16 | 680 | 100 | 188364 | 12-25 | 868 | 235 | 899 | 16.35 | 295.13 | a0 A1 DR ES P1 |
| 11080978 | 9-Aug-2011 | 09:00:16 | 09:01:54 | 09:02:00 | 104 | 40 | 17440 | 6-12 | 871 | 240 | 904 | 16.58 | 295.78 | A1 P1 Q1 |
| Date | Start | Peak | End | Classification | B [deg] | LCM [deg] |
|---|---|---|---|---|---|---|
| No data |

