move the mouse pointer over that image.
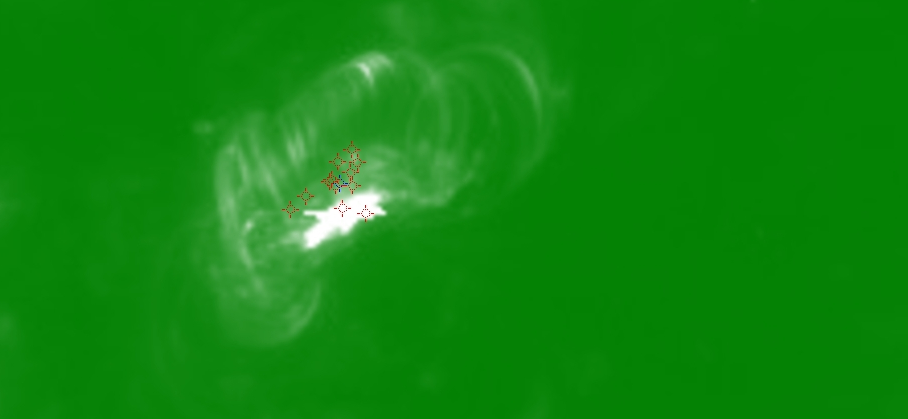
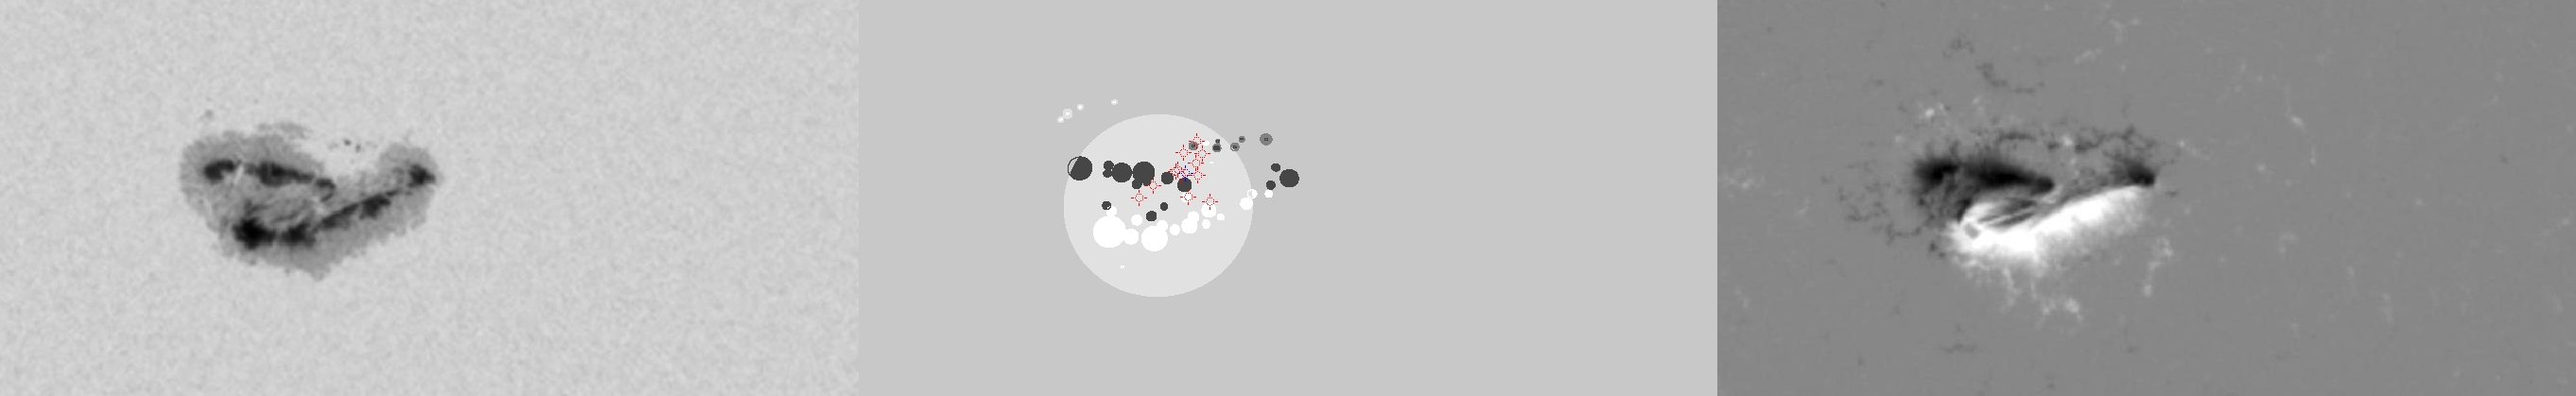
| Evolution of sunspot group NOAA 10720 and positions of flares in it animated by using the data of SOHO/MDI Debrecen Data (SDD) sunspot catalogue (lower panel, middle, ellipses with positions and areas corresponding to the relevant data of spots in SDD and with grey-scale colour coding of the magnetic polarities corresponding to that of the magnetograms), SOHO/MDI continuum images (lower panel, left) and magnetograms (lower panel, right), SOHO/EIT images (upper panel, middle), GOES and RHESSI flare data (red and blue symbols) observed within the interval around the time of SDD data. |
|
When you want to zoom in on one of the images, simply move the mouse pointer over that image. |
 |
| Year | Month | Day | Hour | Min | Sec | NOAA | Proj.U | Proj.WS | Corr.U | Corr.WS | B | L | LCM | Pos.angle | r | MU | MP |
|---|---|---|---|---|---|---|---|---|---|---|---|---|---|---|---|---|---|
| 2005 | 01 | 15 | 12 | 13 | 32 | 10720 | 743 | 4148 | 385 | 2156 | 12.71 | 179.72 | -2.85 | 9.30 | 0.3011 | 336.4 | 5.0 |
| Flare | Date | Start | Peak | End | Dur [s] | Peak [c/s] | Total Counts | Energy [keV] | X pos [asec] | Y pos [asec] | Radial [asec] | B [deg] | L [deg] | Flags |
|---|---|---|---|---|---|---|---|---|---|---|---|---|---|---|
| 50115100 | 15-Jan-2005 | 06:57:40 | 06:58:22 | 07:23:56 | 1576 | 624 | 3280681 | 25-50 | -98 | 318 | 333 | 14.81 | 178.63 | a0 A1 DF P1 |
| 50115135 | 15-Jan-2005 | 08:16:52 | 08:23:42 | 08:33:20 | 988 | 40 | 127176 | 25-50 | -115 | 289 | 311 | 12.99 | 176.86 | A1 DF P1 |
| 50115102 | 15-Jan-2005 | 08:33:20 | 08:36:02 | 08:44:52 | 692 | 26 | 65423 | 12-25 | -102 | 297 | 314 | 13.49 | 177.53 | a0 A1 DF P1 |
| 50115104 | 15-Jan-2005 | 08:52:24 | 08:55:22 | 09:00:08 | 464 | 18 | 34750 | 6-12 | -76 | 319 | 328 | 14.85 | 178.92 | a0 A1 DF P1 |
| 5011526 | 15-Jan-2005 | 09:23:28 | 09:25:54 | 09:26:04 | 156 | 36 | 15766 | 6-12 | -59 | 312 | 317 | 14.41 | 179.70 | a0 A1 DF GE P1 PE |
| 50115106 | 15-Jan-2005 | 09:41:36 | 09:41:42 | 09:49:32 | 476 | 72 | 61350 | 12-25 | -45 | 287 | 291 | 12.83 | 180.43 | a0 A1 DF GS P1 |
| 50115136 | 15-Jan-2005 | 09:49:32 | 09:51:46 | 09:56:44 | 432 | 54 | 41084 | 12-25 | -50 | 304 | 308 | 13.90 | 180.02 | a0 A1 DF P1 |
| 50115107 | 15-Jan-2005 | 09:56:44 | 10:00:38 | 10:00:48 | 244 | 9 | 10369 | 12-25 | -48 | 327 | 331 | 15.35 | 180.05 | A0 DF P1 |
| 50115108 | 15-Jan-2005 | 10:00:48 | 10:08:58 | 10:13:08 | 740 | 23 | 56626 | 6-12 | -56 | 304 | 309 | 13.90 | 179.50 | a0 A1 DF P1 |
| 50115137 | 15-Jan-2005 | 10:13:08 | 10:16:26 | 10:21:48 | 520 | 16 | 36655 | 12-25 | -56 | 308 | 313 | 14.15 | 179.43 | a0 A1 DF P1 |
| 50115138 | 15-Jan-2005 | 10:21:48 | 10:21:58 | 10:27:40 | 352 | 11 | 17823 | 6-12 | -56 | 307 | 312 | 14.09 | 179.38 | a0 A1 DF P1 |
| 50115139 | 15-Jan-2005 | 10:27:40 | 10:30:38 | 10:36:16 | 516 | 42 | 29148 | 12-25 | -45 | 290 | 293 | 13.02 | 179.99 | a0 A1 DF P1 |
| Date | Start | Peak | End | Classification | B [deg] | LCM [deg] |
|---|---|---|---|---|---|---|
| 15-Jan-2005 | 11:41 | 11:48 | 11:50 | M1.2 | 14 | -02 |

