
move the mouse pointer over that image.
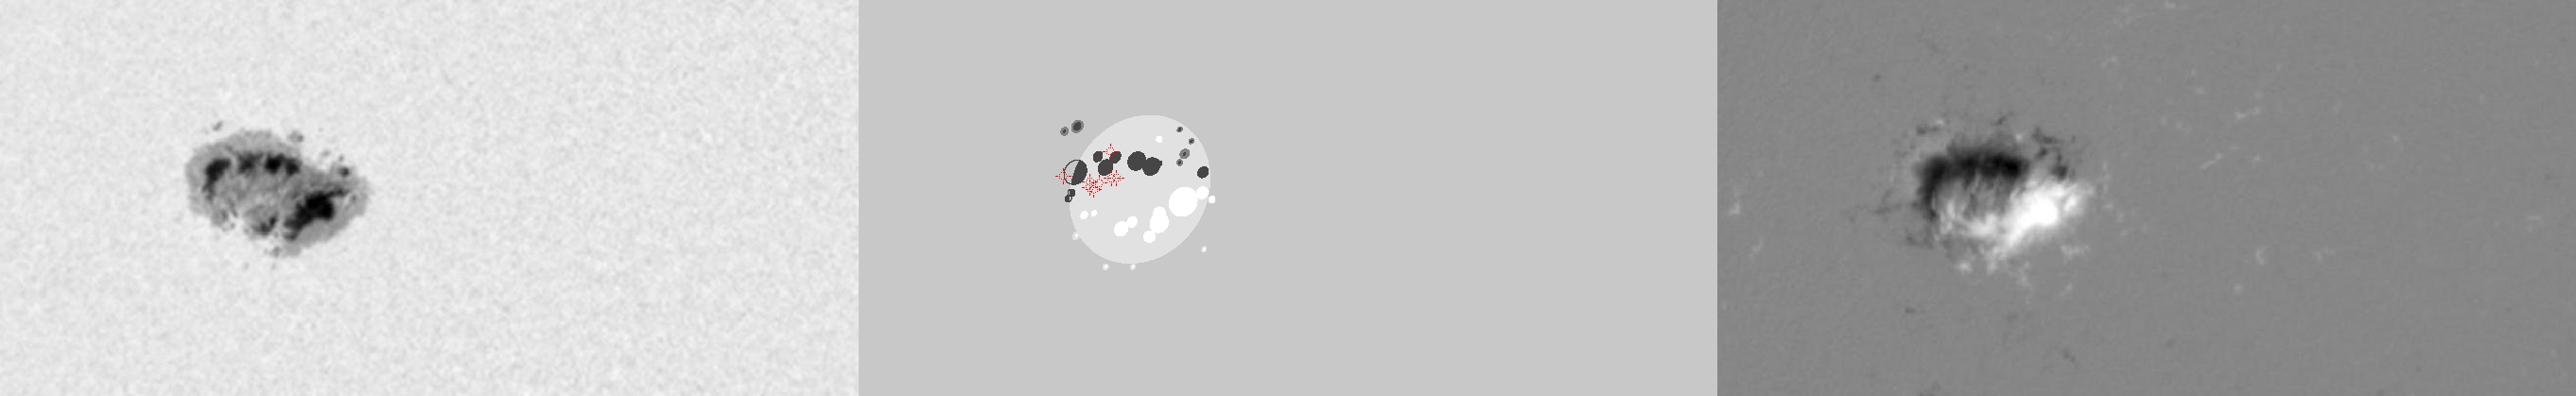
| Evolution of sunspot group NOAA 10720 and positions of flares in it animated by using the data of SOHO/MDI Debrecen Data (SDD) sunspot catalogue (lower panel, middle, ellipses with positions and areas corresponding to the relevant data of spots in SDD and with grey-scale colour coding of the magnetic polarities corresponding to that of the magnetograms), SOHO/MDI continuum images (lower panel, left) and magnetograms (lower panel, right), SOHO/EIT images (upper panel, middle), GOES and RHESSI flare data (red and blue symbols) observed within the interval around the time of SDD data. |
|
When you want to zoom in on one of the images, simply move the mouse pointer over that image. |
 |
| Year | Month | Day | Hour | Min | Sec | NOAA | Proj.U | Proj.WS | Corr.U | Corr.WS | B | L | LCM | Pos.angle | r | MU | MP |
|---|---|---|---|---|---|---|---|---|---|---|---|---|---|---|---|---|---|
| 2005 | 01 | 13 | 17 | 35 | 32 | 10720 | 459 | 2499 | 269 | 1454 | 13.46 | 179.70 | -26.26 | 55.17 | 0.5260 | 76.5 | -1.1 |
| Flare | Date | Start | Peak | End | Dur [s] | Peak [c/s] | Total Counts | Energy [keV] | X pos [asec] | Y pos [asec] | Radial [asec] | B [deg] | L [deg] | Flags |
|---|---|---|---|---|---|---|---|---|---|---|---|---|---|---|
| 5011337 | 13-Jan-2005 | 17:23:20 | 17:24:26 | 17:31:56 | 516 | 624 | 746184 | 6-12 | -421 | 296 | 514 | 14.05 | 178.49 | A0 DR P1 PE |
| 50113137 | 13-Jan-2005 | 17:31:56 | 17:33:58 | 17:38:24 | 388 | 200 | 255168 | 12-25 | -422 | 296 | 516 | 14.05 | 178.34 | A0 DR P1 |
| 5011319 | 13-Jan-2005 | 17:38:24 | 17:40:06 | 17:47:48 | 564 | 152 | 229392 | 6-12 | -421 | 314 | 525 | 15.18 | 178.20 | A0 |
| 50113138 | 13-Jan-2005 | 17:47:48 | 17:53:34 | 17:57:40 | 592 | 96 | 189360 | 6-12 | -431 | 294 | 522 | 13.94 | 177.55 | A0 DR P1 |
| 5011353 | 13-Jan-2005 | 17:57:40 | 18:01:22 | 18:03:08 | 328 | 88 | 93888 | 6-12 | -423 | 293 | 515 | 13.86 | 178.04 | A0 DR P1 PE |
| 5011338 | 13-Jan-2005 | 18:03:08 | 18:04:58 | 18:09:04 | 356 | 96 | 141696 | 6-12 | -446 | 298 | 537 | 14.23 | 176.36 | A0 DR P1 PE |
| 50113139 | 13-Jan-2005 | 18:09:04 | 18:13:54 | 18:16:40 | 456 | 336 | 482400 | 12-25 | -426 | 290 | 516 | 13.68 | 177.74 | A0 DR P1 |
| 5011321 | 13-Jan-2005 | 18:16:40 | 18:17:38 | 18:25:36 | 536 | 240 | 283488 | 12-25 | -422 | 289 | 512 | 13.61 | 177.99 | A0 DR P1 |
| Date | Start | Peak | End | Classification | B [deg] | LCM [deg] |
|---|---|---|---|---|---|---|
| No data |

