move the mouse pointer over that image.
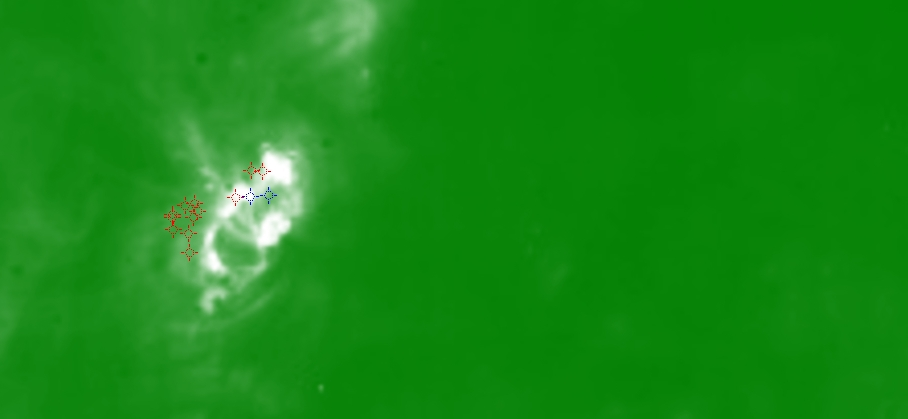
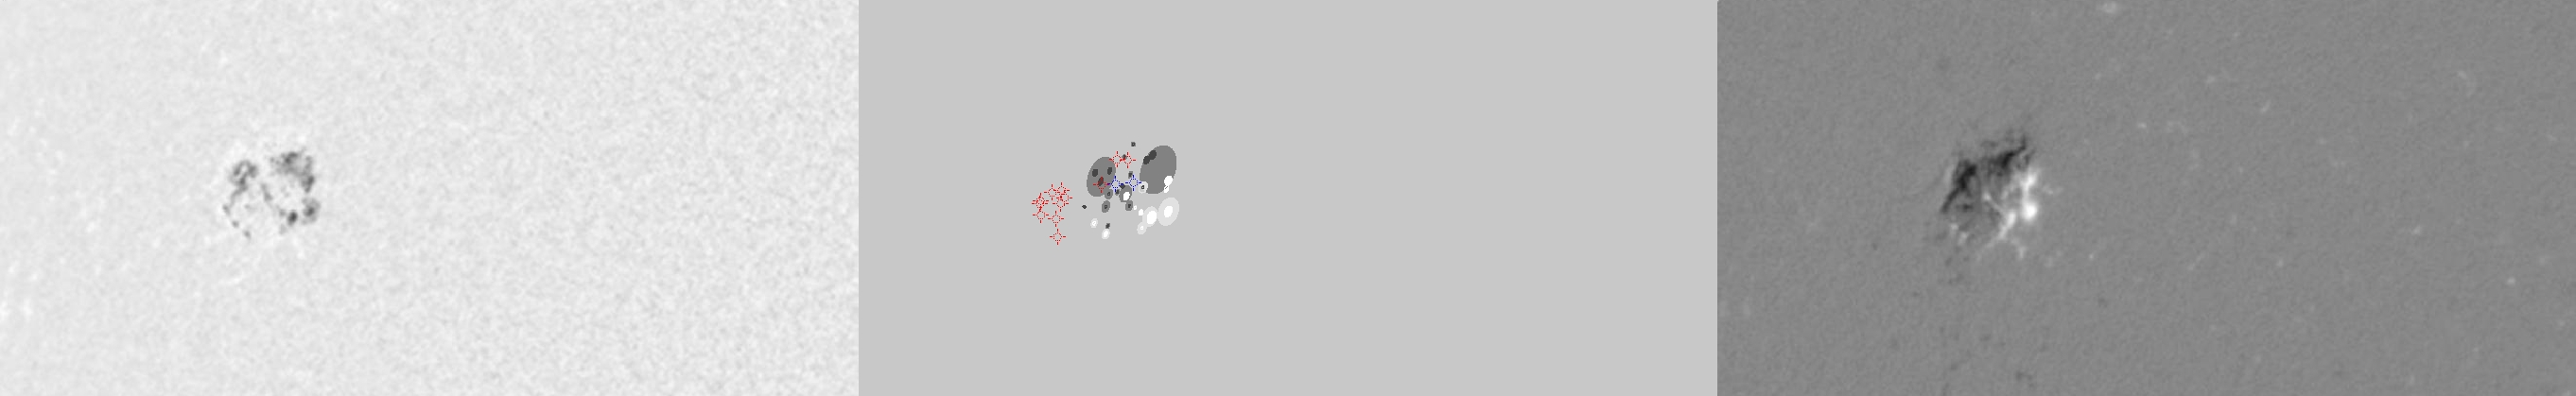
| Evolution of sunspot group NOAA 10720 and positions of flares in it animated by using the data of SOHO/MDI Debrecen Data (SDD) sunspot catalogue (lower panel, middle, ellipses with positions and areas corresponding to the relevant data of spots in SDD and with grey-scale colour coding of the magnetic polarities corresponding to that of the magnetograms), SOHO/MDI continuum images (lower panel, left) and magnetograms (lower panel, right), SOHO/EIT images (upper panel, middle), GOES and RHESSI flare data (red and blue symbols) observed within the interval around the time of SDD data. |
|
When you want to zoom in on one of the images, simply move the mouse pointer over that image. |
 |
| Year | Month | Day | Hour | Min | Sec | NOAA | Proj.U | Proj.WS | Corr.U | Corr.WS | B | L | LCM | Pos.angle | r | MU | MP |
|---|---|---|---|---|---|---|---|---|---|---|---|---|---|---|---|---|---|
| 2005 | 01 | 12 | 03 | 47 | 32 | 10720 | 68 | 510 | 54 | 396 | 13.77 | 179.28 | -47.44 | 68.21 | 0.7724 | 159.8 | -146.8 |
| Flare | Date | Start | Peak | End | Dur [s] | Peak [c/s] | Total Counts | Energy [keV] | X pos [asec] | Y pos [asec] | Radial [asec] | B [deg] | L [deg] | Flags |
|---|---|---|---|---|---|---|---|---|---|---|---|---|---|---|
| 5011244 | 12-Jan-2005 | 01:57:04 | 01:57:34 | 01:58:52 | 108 | 24 | 11160 | 6-12 | -724 | 275 | 774 | 14.02 | 176.03 | A0 |
| 5011245 | 12-Jan-2005 | 03:19:16 | 03:20:34 | 03:22:08 | 172 | 28 | 18936 | 6-12 | -691 | 293 | 751 | 14.97 | 178.12 | A0 |
| 5011298 | 12-Jan-2005 | 03:56:00 | 03:56:30 | 03:57:04 | 64 | 22 | 5328 | 6-12 | -691 | 294 | 751 | 15.04 | 177.77 | A0 DR P1 |
| 5011249 | 12-Jan-2005 | 04:55:28 | 04:59:54 | 05:05:16 | 588 | 112 | 147576 | 6-12 | -717 | 266 | 765 | 13.40 | 175.23 | A0 |
| 5011250 | 12-Jan-2005 | 05:11:24 | 05:11:58 | 05:13:12 | 108 | 24 | 11112 | 6-12 | -712 | 270 | 761 | 13.62 | 175.53 | A0 |
| 5011251 | 12-Jan-2005 | 05:14:40 | 05:15:38 | 05:16:04 | 84 | 24 | 9624 | 6-12 | -716 | 244 | 757 | 12.01 | 175.55 | A0 |
| 5011253 | 12-Jan-2005 | 05:26:08 | 05:26:38 | 05:29:44 | 216 | 20 | 20832 | 6-12 | -715 | 256 | 760 | 12.76 | 175.35 | A0 |
| 5011255 | 12-Jan-2005 | 05:37:00 | 05:37:42 | 05:41:28 | 268 | 20 | 26136 | 6-12 | -709 | 275 | 760 | 13.92 | 175.49 | A0 DR P1 |
| 5011256 | 12-Jan-2005 | 06:30:00 | 06:32:58 | 06:38:24 | 504 | 34 | 75240 | 6-12 | -713 | 260 | 760 | 12.99 | 174.87 | A0 GS P1 |
| 5011299 | 12-Jan-2005 | 06:38:24 | 06:38:34 | 06:43:44 | 320 | 18 | 29112 | 6-12 | -704 | 275 | 756 | 13.89 | 175.42 | A0 |
| 5011203 | 12-Jan-2005 | 06:59:40 | 07:07:26 | 07:12:04 | 744 | 1648 | 2299560 | 6-12 | -707 | 270 | 757 | 13.59 | 174.96 | A0 |
| 50112100 | 12-Jan-2005 | 07:12:04 | 07:14:10 | 07:19:28 | 444 | 336 | 359232 | 6-12 | -706 | 268 | 755 | 13.46 | 175.02 | A0 |
| Date | Start | Peak | End | Classification | B [deg] | LCM [deg] |
|---|---|---|---|---|---|---|
| 12-Jan-2005 | 01:22 | 01:25 | 01:30 | B1.9 | 14 | -49 |
| 12-Jan-2005 | 07:01 | 07:08 | 07:17 | B7.0 | 14 | -47 |

