move the mouse pointer over that image.
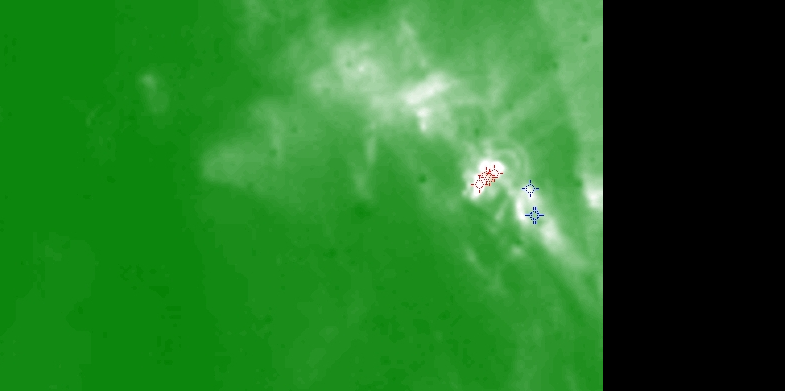
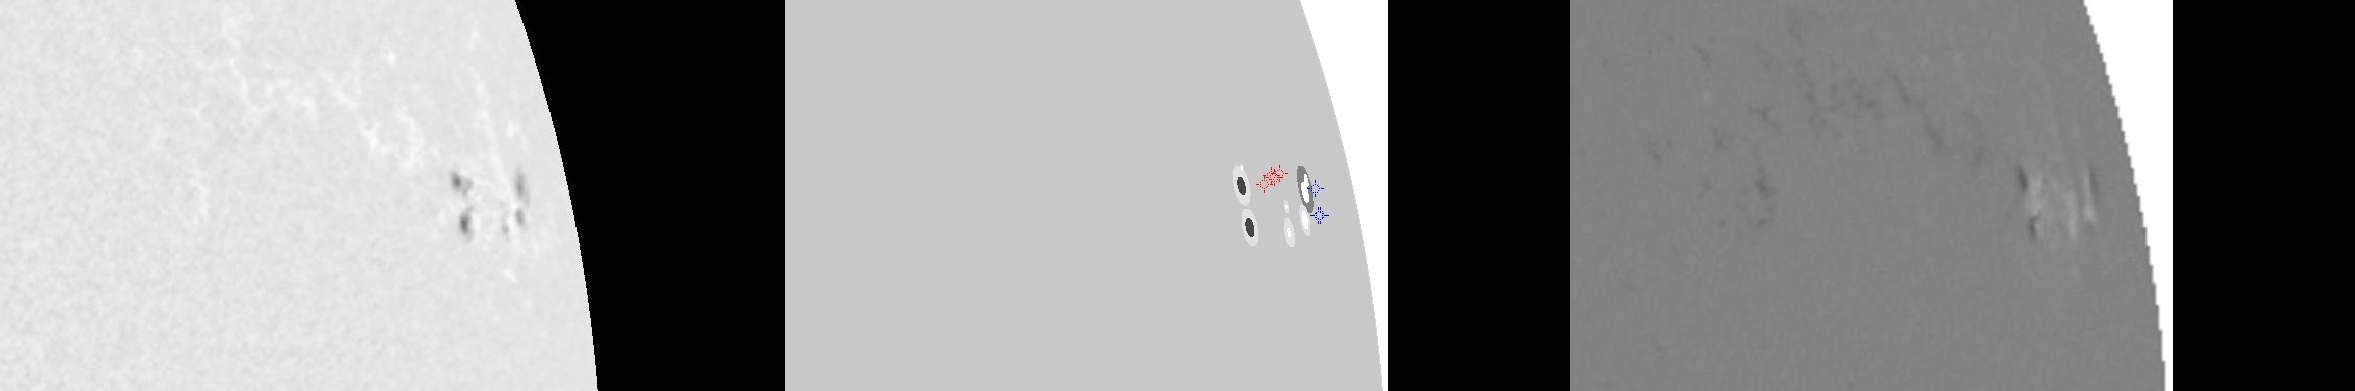
| Evolution of sunspot group NOAA 10691 and positions of flares in it animated by using the data of SOHO/MDI Debrecen Data (SDD) sunspot catalogue (lower panel, middle, ellipses with positions and areas corresponding to the relevant data of spots in SDD and with grey-scale colour coding of the magnetic polarities corresponding to that of the magnetograms), SOHO/MDI continuum images (lower panel, left) and magnetograms (lower panel, right), SOHO/EIT images (upper panel, middle), GOES and RHESSI flare data (red and blue symbols) observed within the interval around the time of SDD data. |
|
When you want to zoom in on one of the images, simply move the mouse pointer over that image. |
 |
| Year | Month | Day | Hour | Min | Sec | NOAA | Proj.U | Proj.WS | Corr.U | Corr.WS | B | L | LCM | Pos.angle | r | MU | MP |
|---|---|---|---|---|---|---|---|---|---|---|---|---|---|---|---|---|---|
| 2004 | 11 | 03 | 07 | 59 | 32 | 10691 | 51 | 239 | 84 | 382 | 12.88 | 139.56 | 72.33 | 282.25 | 0.9502 | 27.3 | 113.4 |
| Flare | Date | Start | Peak | End | Dur [s] | Peak [c/s] | Total Counts | Energy [keV] | X pos [asec] | Y pos [asec] | Radial [asec] | B [deg] | L [deg] | Flags |
|---|---|---|---|---|---|---|---|---|---|---|---|---|---|---|
| 4110390 | 3-Nov-2004 | 06:55:40 | 07:07:50 | 07:16:00 | 1220 | 2544 | 5668176 | 12-25 | 892 | 210 | 916 | 13.89 | 139.59 | A0 DR P1 |
| 4110358 | 3-Nov-2004 | 07:16:00 | 07:17:26 | 07:25:56 | 596 | 1456 | 2094336 | 12-25 | 888 | 209 | 912 | 13.89 | 138.66 | A0 |
| 4110391 | 3-Nov-2004 | 07:25:56 | 07:29:34 | 07:30:44 | 288 | 4848 | 1825800 | 12-25 | 885 | 204 | 908 | 13.63 | 137.76 | A0 EE P1 |
| 4110344 | 3-Nov-2004 | 08:06:00 | 08:06:10 | 08:06:20 | 20 | 9 | 761 | 6-12 | 894 | 209 | 918 | 13.80 | 139.42 | A0 GE P1 PE |
| Date | Start | Peak | End | Classification | B [deg] | LCM [deg] |
|---|---|---|---|---|---|---|
| 3-Nov-2004 | 07:05 | 07:18 | 07:24 | C1.5 | 13 | 77 |
| 3-Nov-2004 | 07:27 | 07:30 | 07:32 | C1.5 | 12 | 77 |
| 3-Nov-2004 | 07:53 | 07:58 | 08:03 | C1.2 | 12 | 77 |

