move the mouse pointer over that image.
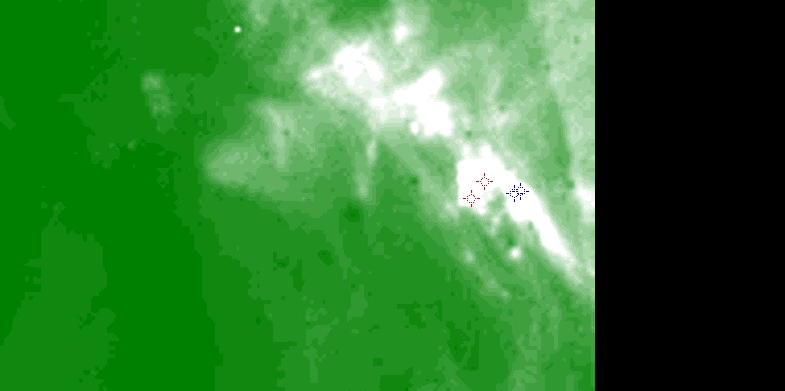
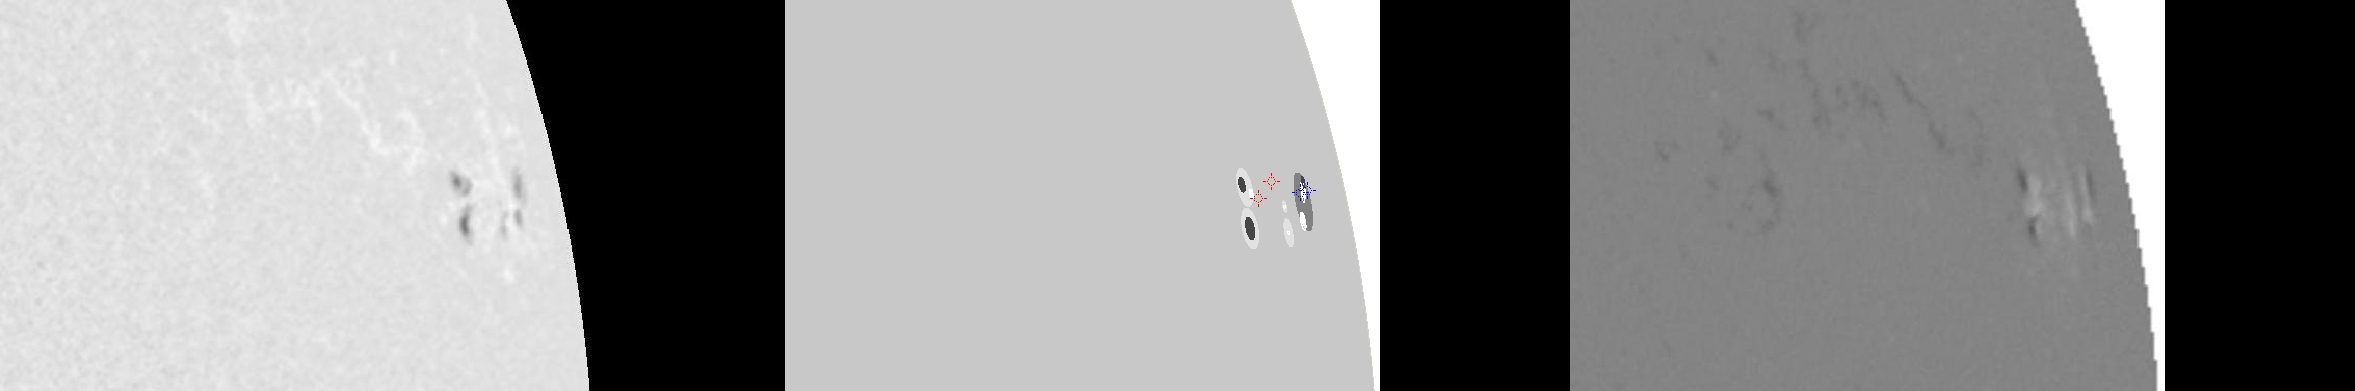
| Evolution of sunspot group NOAA 10691 and positions of flares in it animated by using the data of SOHO/MDI Debrecen Data (SDD) sunspot catalogue (lower panel, middle, ellipses with positions and areas corresponding to the relevant data of spots in SDD and with grey-scale colour coding of the magnetic polarities corresponding to that of the magnetograms), SOHO/MDI continuum images (lower panel, left) and magnetograms (lower panel, right), SOHO/EIT images (upper panel, middle), GOES and RHESSI flare data (red and blue symbols) observed within the interval around the time of SDD data. |
|
When you want to zoom in on one of the images, simply move the mouse pointer over that image. |
 |
| Year | Month | Day | Hour | Min | Sec | NOAA | Proj.U | Proj.WS | Corr.U | Corr.WS | B | L | LCM | Pos.angle | r | MU | MP |
|---|---|---|---|---|---|---|---|---|---|---|---|---|---|---|---|---|---|
| 2004 | 11 | 03 | 09 | 35 | 32 | 10691 | 54 | 237 | 91 | 399 | 12.77 | 139.65 | 73.31 | 282.15 | 0.9552 | 21.7 | 94.5 |
| Flare | Date | Start | Peak | End | Dur [s] | Peak [c/s] | Total Counts | Energy [keV] | X pos [asec] | Y pos [asec] | Radial [asec] | B [deg] | L [deg] | Flags |
|---|---|---|---|---|---|---|---|---|---|---|---|---|---|---|
| 4110316 | 3-Nov-2004 | 08:52:32 | 08:54:58 | 09:06:44 | 852 | 288 | 504076 | 12-25 | 893 | 207 | 917 | 13.70 | 138.67 | a0 A1 EE P1 |
| 4110392 | 3-Nov-2004 | 10:20:12 | 10:21:42 | 10:25:36 | 324 | 28 | 45033 | 6-12 | 893 | 198 | 915 | 13.18 | 137.46 | A0 |
| Date | Start | Peak | End | Classification | B [deg] | LCM [deg] |
|---|---|---|---|---|---|---|
| 3-Nov-2004 | 08:52 | 08:58 | 09:02 | C5.3 | 13 | 77 |
| 3-Nov-2004 | 09:04 | 09:09 | 09:13 | C8.4 | 13 | 76 |

