move the mouse pointer over that image.
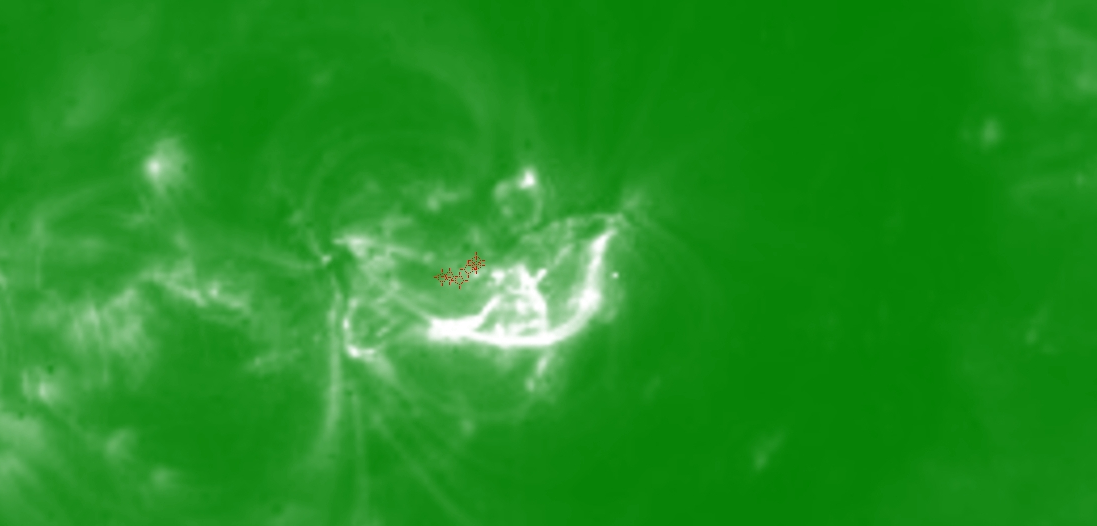
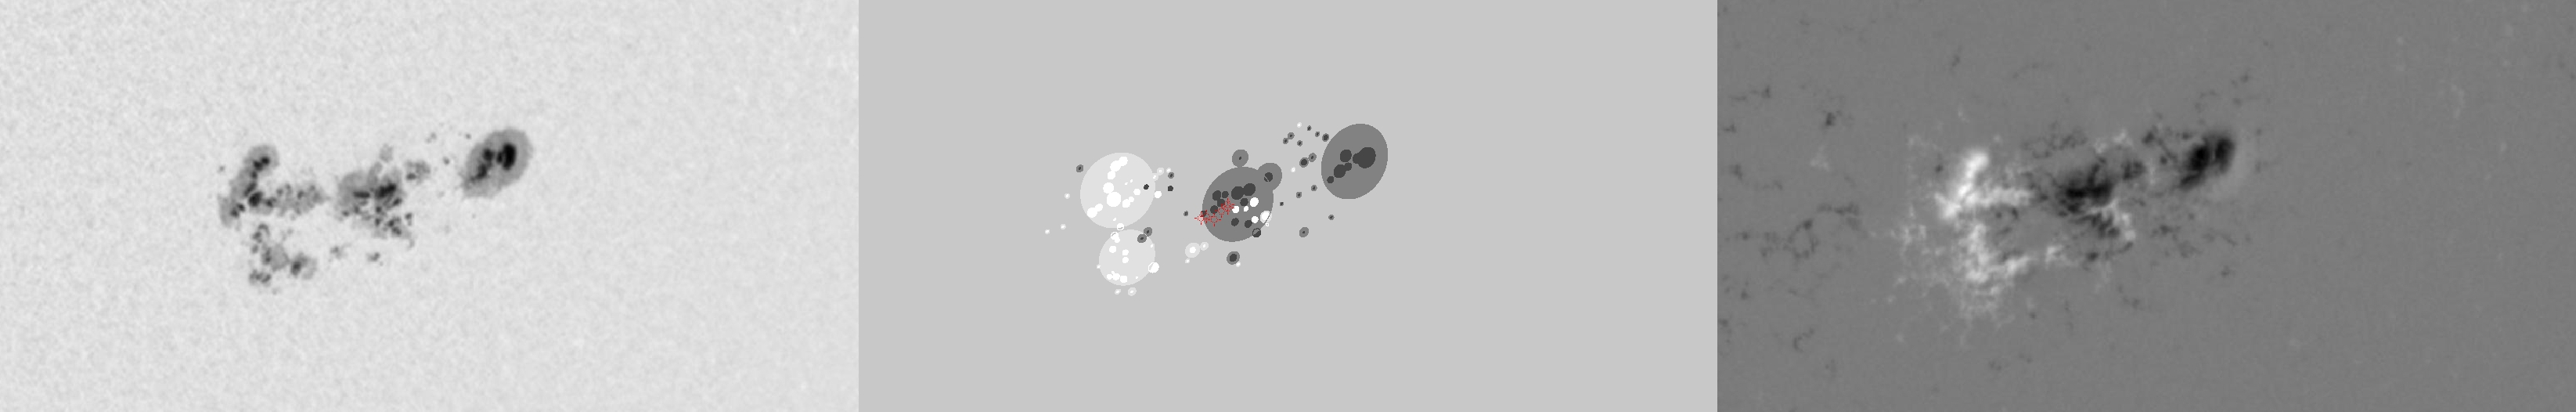
| Evolution of sunspot group NOAA 10656 and positions of flares in it animated by using the data of SOHO/MDI Debrecen Data (SDD) sunspot catalogue (lower panel, middle, ellipses with positions and areas corresponding to the relevant data of spots in SDD and with grey-scale colour coding of the magnetic polarities corresponding to that of the magnetograms), SOHO/MDI continuum images (lower panel, left) and magnetograms (lower panel, right), SOHO/EIT images (upper panel, middle), GOES and RHESSI flare data (red and blue symbols) observed within the interval around the time of SDD data. |
|
When you want to zoom in on one of the images, simply move the mouse pointer over that image. |
 |
| Year | Month | Day | Hour | Min | Sec | NOAA | Proj.U | Proj.WS | Corr.U | Corr.WS | B | L | LCM | Pos.angle | r | MU | MP |
|---|---|---|---|---|---|---|---|---|---|---|---|---|---|---|---|---|---|
| 2004 | 08 | 14 | 01 | 35 | 32 | 10656 | 562 | 3676 | 328 | 2165 | -12.43 | 85.52 | 26.10 | 233.17 | 0.5364 | -187.3 | -118.8 |
| Flare | Date | Start | Peak | End | Dur [s] | Peak [c/s] | Total Counts | Energy [keV] | X pos [asec] | Y pos [asec] | Radial [asec] | B [deg] | L [deg] | Flags |
|---|---|---|---|---|---|---|---|---|---|---|---|---|---|---|
| 4081467 | 14-Aug-2004 | 00:49:04 | 00:51:06 | 00:52:12 | 188 | 5 | 3361 | 12-25 | 414 | -310 | 518 | -12.92 | 85.33 | A0 DF P1 |
| 4081468 | 14-Aug-2004 | 00:53:04 | 00:54:02 | 00:54:44 | 100 | 5 | 2023 | 12-25 | 415 | -313 | 520 | -13.11 | 85.40 | A0 DF P1 |
| 4081405 | 14-Aug-2004 | 01:29:56 | 01:32:58 | 01:40:04 | 608 | 592 | 1028376 | 12-25 | 404 | -320 | 516 | -13.52 | 84.34 | A0 DF ES P1 |
| 40814112 | 14-Aug-2004 | 01:40:04 | 01:42:22 | 01:49:12 | 548 | 352 | 501408 | 6-12 | 411 | -319 | 521 | -13.48 | 84.72 | A0 DF P1 |
| 40814113 | 14-Aug-2004 | 01:49:12 | 02:04:46 | 02:18:48 | 1776 | 688 | 3893472 | 12-25 | 423 | -321 | 531 | -13.65 | 85.36 | A0 DF DR P1 |
| 4081470 | 14-Aug-2004 | 02:18:48 | 02:20:46 | 02:24:40 | 352 | 272 | 367680 | 6-12 | 433 | -314 | 535 | -13.24 | 85.85 | A0 DF P1 |
| Date | Start | Peak | End | Classification | B [deg] | LCM [deg] |
|---|---|---|---|---|---|---|
| No data |

