move the mouse pointer over that image.
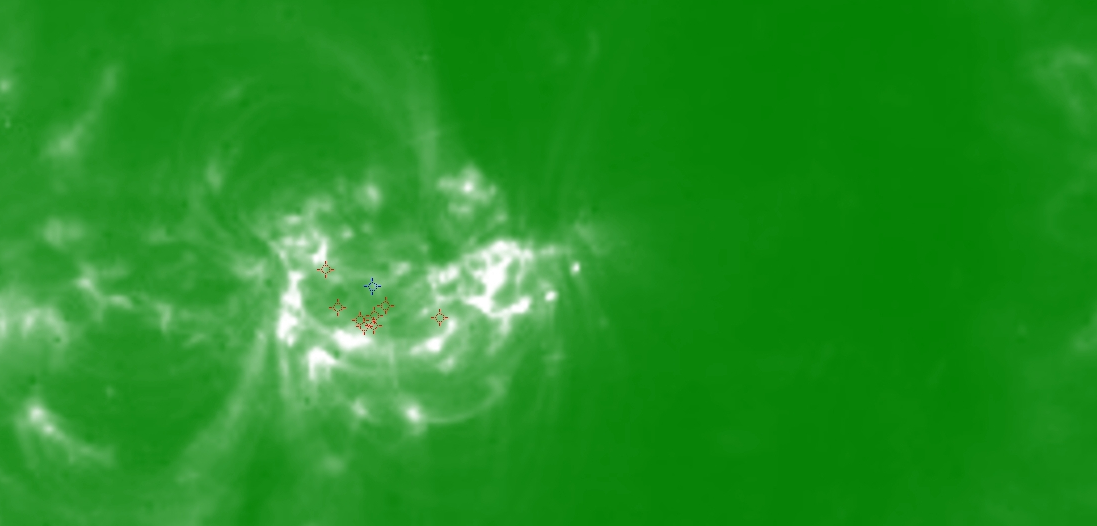
| Evolution of sunspot group NOAA 10656 and positions of flares in it animated by using the data of SOHO/MDI Debrecen Data (SDD) sunspot catalogue (lower panel, middle, ellipses with positions and areas corresponding to the relevant data of spots in SDD and with grey-scale colour coding of the magnetic polarities corresponding to that of the magnetograms), SOHO/MDI continuum images (lower panel, left) and magnetograms (lower panel, right), SOHO/EIT images (upper panel, middle), GOES and RHESSI flare data (red and blue symbols) observed within the interval around the time of SDD data. |
|
When you want to zoom in on one of the images, simply move the mouse pointer over that image. |
 |
| Year | Month | Day | Hour | Min | Sec | NOAA | Proj.U | Proj.WS | Corr.U | Corr.WS | B | L | LCM | Pos.angle | r | MU | MP |
|---|---|---|---|---|---|---|---|---|---|---|---|---|---|---|---|---|---|
| 2004 | 08 | 13 | 01 | 35 | 32 | 10656 | 541 | 3922 | 291 | 2116 | -12.62 | 85.03 | 12.39 | 211.94 | 0.3936 | -389.0 | -101.1 |
| Flare | Date | Start | Peak | End | Dur [s] | Peak [c/s] | Total Counts | Energy [keV] | X pos [asec] | Y pos [asec] | Radial [asec] | B [deg] | L [deg] | Flags |
|---|---|---|---|---|---|---|---|---|---|---|---|---|---|---|
| 40813116 | 13-Aug-2004 | 00:43:08 | 00:51:38 | 00:54:24 | 676 | 184 | 408576 | 6-12 | 189 | -347 | 395 | -14.76 | 84.08 | A0 DF P1 PE |
| 4081382 | 13-Aug-2004 | 01:29:40 | 01:31:50 | 01:35:12 | 332 | 100 | 136896 | 6-12 | 171 | -348 | 388 | -14.79 | 82.58 | A0 DF P1 |
| 40813117 | 13-Aug-2004 | 01:35:12 | 01:36:58 | 01:43:00 | 468 | 80 | 132528 | 6-12 | 189 | -360 | 406 | -15.59 | 83.71 | A0 DF P1 |
| 40813118 | 13-Aug-2004 | 01:43:00 | 01:46:02 | 01:50:32 | 452 | 52 | 102624 | 6-12 | 198 | -353 | 405 | -15.15 | 84.17 | A0 DF P1 |
| 4081362 | 13-Aug-2004 | 01:50:32 | 01:52:14 | 01:53:44 | 192 | 60 | 42000 | 6-12 | 191 | -356 | 404 | -15.33 | 83.68 | A0 DF P1 |
| 40813119 | 13-Aug-2004 | 01:53:44 | 01:56:34 | 02:02:56 | 552 | 752 | 900144 | 12-25 | 171 | -324 | 367 | -13.26 | 82.28 | A0 DF P1 |
| 4081305 | 13-Aug-2004 | 02:02:56 | 02:05:18 | 02:17:28 | 872 | 192 | 453120 | 6-12 | 244 | -354 | 430 | -15.30 | 86.92 | A0 DF DR P1 |
| 4081383 | 13-Aug-2004 | 02:17:28 | 02:19:38 | 02:20:56 | 208 | 88 | 70512 | 6-12 | 207 | -359 | 415 | -15.55 | 84.45 | A0 DF P1 |
| Date | Start | Peak | End | Classification | B [deg] | LCM [deg] |
|---|---|---|---|---|---|---|
| 13-Aug-2004 | 00:56 | 01:02 | 01:08 | C2.2 | -14 | 11 |

