move the mouse pointer over that image.
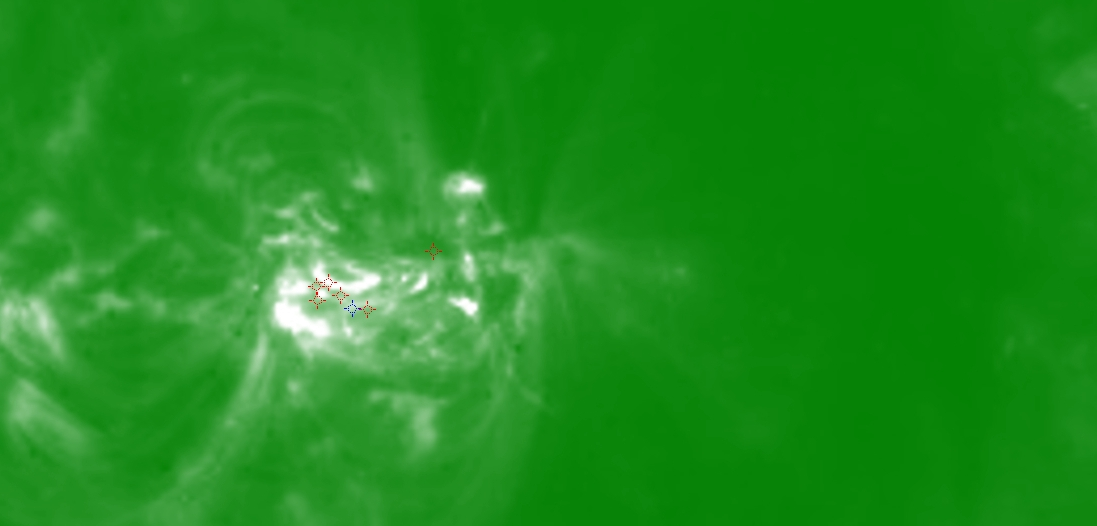
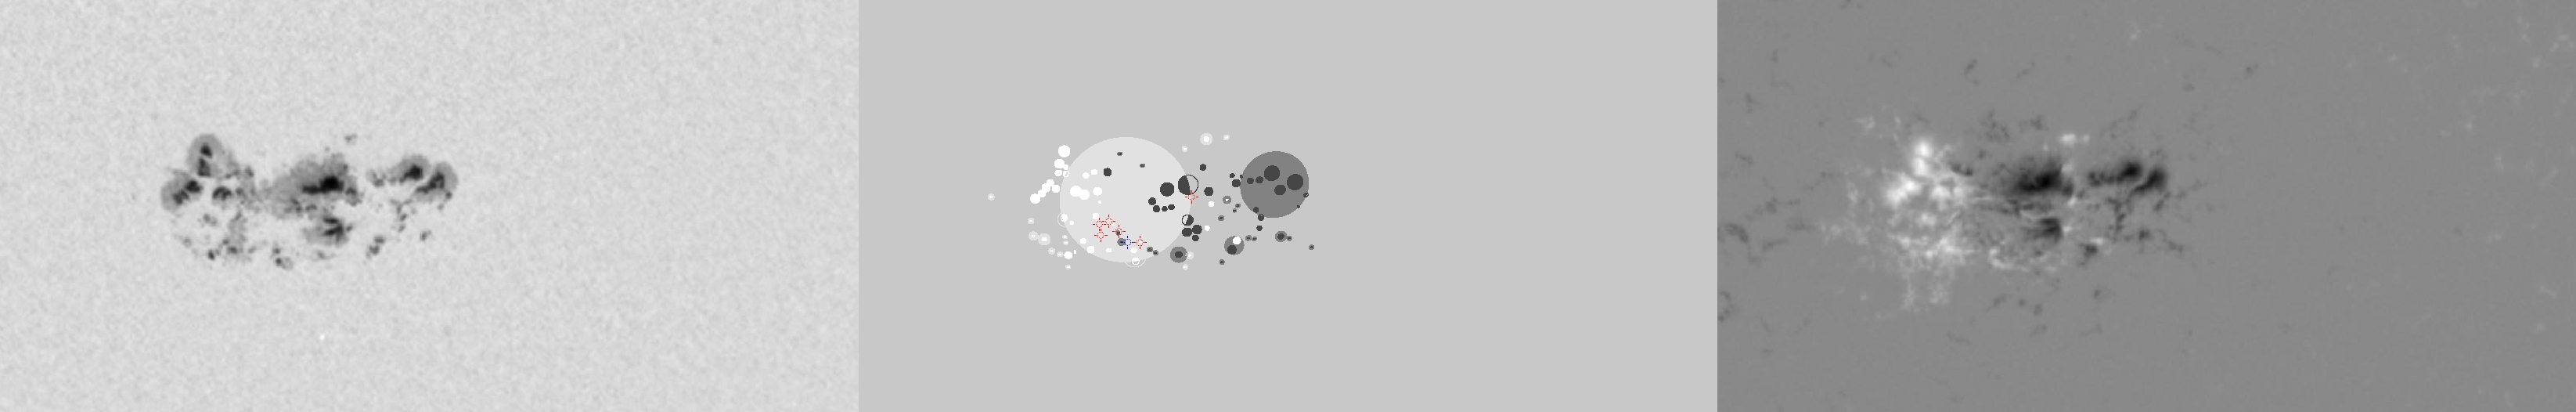
| Evolution of sunspot group NOAA 10656 and positions of flares in it animated by using the data of SOHO/MDI Debrecen Data (SDD) sunspot catalogue (lower panel, middle, ellipses with positions and areas corresponding to the relevant data of spots in SDD and with grey-scale colour coding of the magnetic polarities corresponding to that of the magnetograms), SOHO/MDI continuum images (lower panel, left) and magnetograms (lower panel, right), SOHO/EIT images (upper panel, middle), GOES and RHESSI flare data (red and blue symbols) observed within the interval around the time of SDD data. |
|
When you want to zoom in on one of the images, simply move the mouse pointer over that image. |
 |
| Year | Month | Day | Hour | Min | Sec | NOAA | Proj.U | Proj.WS | Corr.U | Corr.WS | B | L | LCM | Pos.angle | r | MU | MP |
|---|---|---|---|---|---|---|---|---|---|---|---|---|---|---|---|---|---|
| 2004 | 08 | 12 | 11 | 11 | 32 | 10656 | 615 | 4036 | 322 | 2131 | -12.67 | 84.79 | 4.23 | 191.91 | 0.3433 | -386.8 | -110.4 |
| Flare | Date | Start | Peak | End | Dur [s] | Peak [c/s] | Total Counts | Energy [keV] | X pos [asec] | Y pos [asec] | Radial [asec] | B [deg] | L [deg] | Flags |
|---|---|---|---|---|---|---|---|---|---|---|---|---|---|---|
| 40812118 | 12-Aug-2004 | 10:26:08 | 10:28:58 | 10:29:52 | 224 | 1 | 1049 | 6-12 | 52 | -353 | 357 | -15.04 | 83.49 | A0 DF P1 |
| 4081261 | 12-Aug-2004 | 11:05:32 | 11:07:14 | 11:09:36 | 244 | 5 | 3914 | 6-12 | 31 | -338 | 340 | -14.08 | 81.84 | A0 DF P1 |
| 40812119 | 12-Aug-2004 | 11:09:36 | 11:11:34 | 11:15:48 | 372 | 3 | 3816 | 6-12 | 40 | -336 | 338 | -13.95 | 82.35 | A0 DF P1 |
| 4081262 | 12-Aug-2004 | 11:17:04 | 11:18:42 | 11:22:48 | 344 | 9 | 6873 | 12-25 | 108 | -316 | 334 | -12.72 | 86.43 | A0 DF DR P1 |
| 40812120 | 12-Aug-2004 | 11:22:48 | 11:41:10 | 11:51:52 | 1744 | 28 | 122259 | 6-12 | 42 | -347 | 350 | -14.65 | 82.21 | a0 A1 DF DR P1 |
| 4081289 | 12-Aug-2004 | 11:51:52 | 11:53:18 | 11:56:56 | 304 | 4 | 3998 | 12-25 | 60 | -344 | 349 | -14.47 | 83.20 | A0 DF P1 |
| Date | Start | Peak | End | Classification | B [deg] | LCM [deg] |
|---|---|---|---|---|---|---|
| 12-Aug-2004 | 11:27 | 11:43 | 11:52 | C4.9 | -15 | 03 |

