move the mouse pointer over that image.
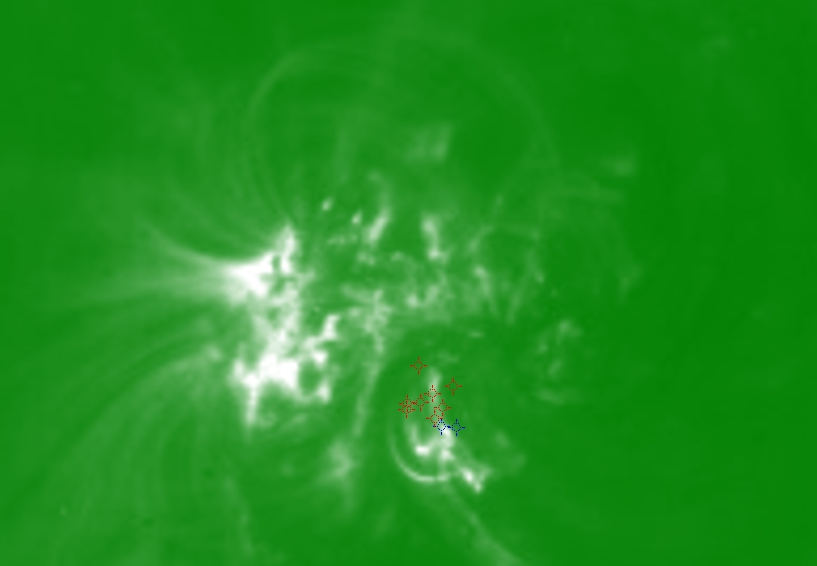
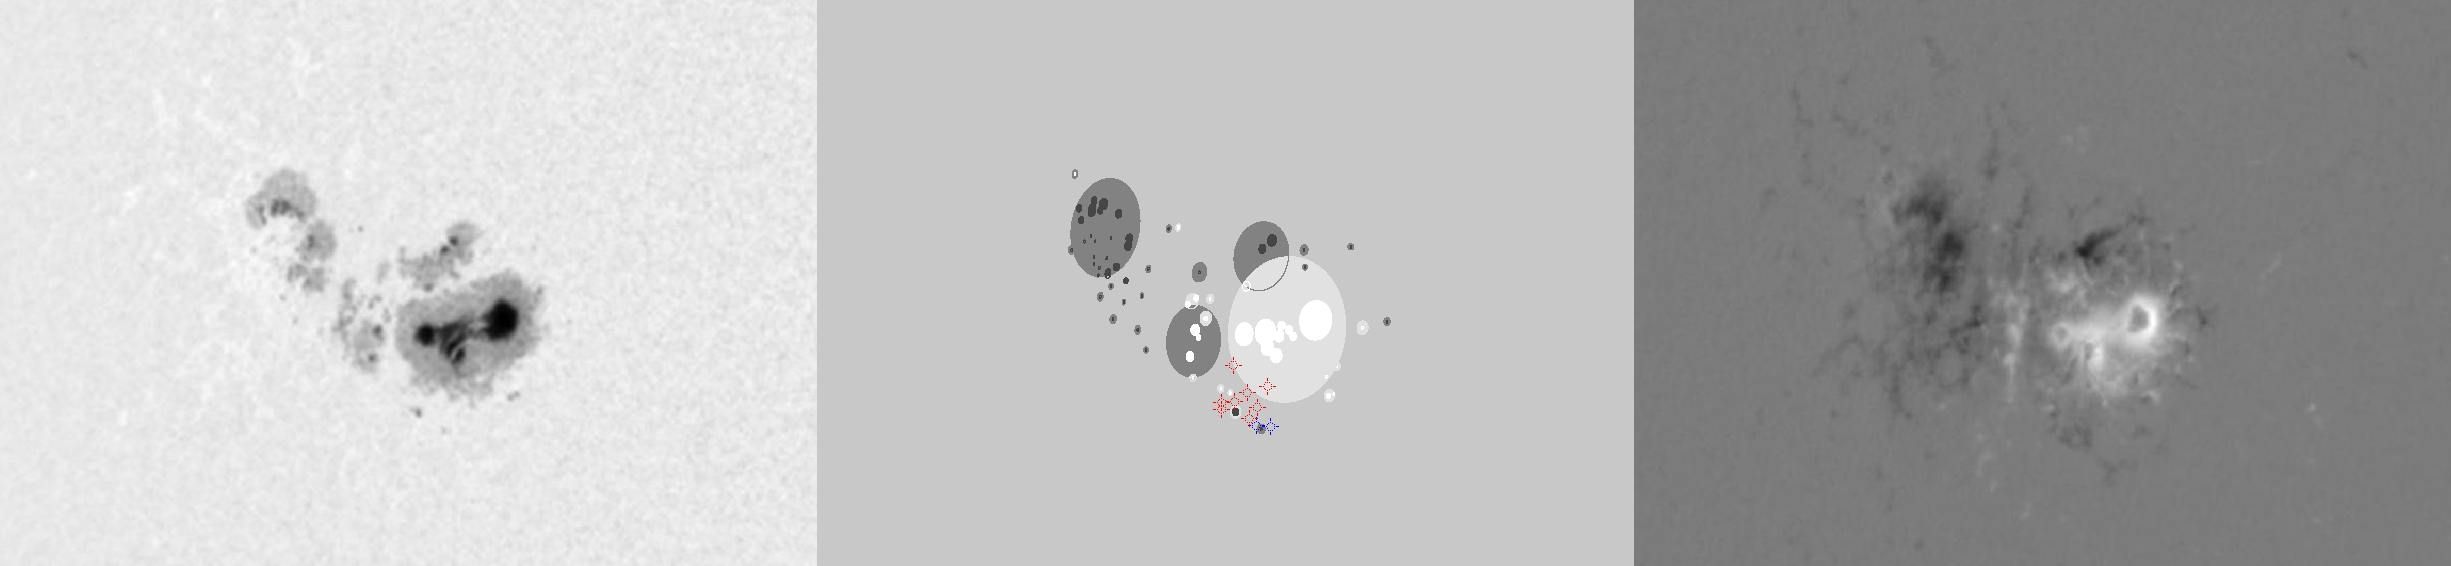
| Evolution of sunspot group NOAA 10652 and positions of flares in it animated by using the data of SOHO/MDI Debrecen Data (SDD) sunspot catalogue (lower panel, middle, ellipses with positions and areas corresponding to the relevant data of spots in SDD and with grey-scale colour coding of the magnetic polarities corresponding to that of the magnetograms), SOHO/MDI continuum images (lower panel, left) and magnetograms (lower panel, right), SOHO/EIT images (upper panel, middle), GOES and RHESSI flare data (red and blue symbols) observed within the interval around the time of SDD data. |
|
When you want to zoom in on one of the images, simply move the mouse pointer over that image. |
 |
| Year | Month | Day | Hour | Min | Sec | NOAA | Proj.U | Proj.WS | Corr.U | Corr.WS | B | L | LCM | Pos.angle | r | MU | MP |
|---|---|---|---|---|---|---|---|---|---|---|---|---|---|---|---|---|---|
| 2004 | 07 | 20 | 04 | 47 | 32 | 10652 | 437 | 3586 | 280 | 2352 | 8.62 | 347.54 | -40.80 | 82.48 | 0.6524 | 729.7 | 93.1 |
| Flare | Date | Start | Peak | End | Dur [s] | Peak [c/s] | Total Counts | Energy [keV] | X pos [asec] | Y pos [asec] | Radial [asec] | B [deg] | L [deg] | Flags |
|---|---|---|---|---|---|---|---|---|---|---|---|---|---|---|
| 4072094 | 20-Jul-2004 | 04:00:08 | 04:02:22 | 04:03:32 | 204 | 38 | 30864 | 6-12 | -617 | 43 | 618 | 6.20 | -12.12 | A0 DR P1 |
| 4072040 | 20-Jul-2004 | 04:03:32 | 04:06:22 | 04:06:56 | 204 | 46 | 39144 | 6-12 | -615 | 20 | 615 | 4.84 | -11.89 | A0 DR P1 PE |
| 4072012 | 20-Jul-2004 | 04:35:08 | 04:40:02 | 04:41:16 | 368 | 784 | 749664 | 12-25 | -598 | 9 | 598 | 4.26 | -10.85 | A0 GE P1 PE |
| 4072070 | 20-Jul-2004 | 04:50:08 | 04:50:14 | 04:51:48 | 100 | 80 | 44352 | 6-12 | -597 | 25 | 598 | 5.21 | -10.93 | A0 DR GS P1 |
| 4072095 | 20-Jul-2004 | 04:51:48 | 04:56:34 | 05:06:52 | 904 | 3184 | 3260064 | 25-50 | -589 | 16 | 589 | 4.71 | -10.34 | A0 DR P1 |
| 4072047 | 20-Jul-2004 | 05:06:52 | 05:14:58 | 05:21:48 | 896 | 152 | 362832 | 6-12 | -578 | 29 | 579 | 5.52 | -9.74 | A0 DR P1 |
| 4072071 | 20-Jul-2004 | 05:21:48 | 05:24:18 | 05:26:32 | 284 | 76 | 91632 | 6-12 | -605 | 18 | 605 | 4.77 | -11.82 | A0 |
| 4072072 | 20-Jul-2004 | 05:26:32 | 05:28:38 | 05:35:32 | 540 | 92 | 161616 | 6-12 | -604 | 14 | 605 | 4.53 | -11.77 | A0 DR P1 |
| Date | Start | Peak | End | Classification | B [deg] | LCM [deg] |
|---|---|---|---|---|---|---|
| 20-Jul-2004 | 04:11 | 04:23 | 04:30 | C2.3 | 04 | -39 |
| 20-Jul-2004 | 04:53 | 04:57 | 05:00 | C1.4 | 04 | -38 |

