move the mouse pointer over that image.
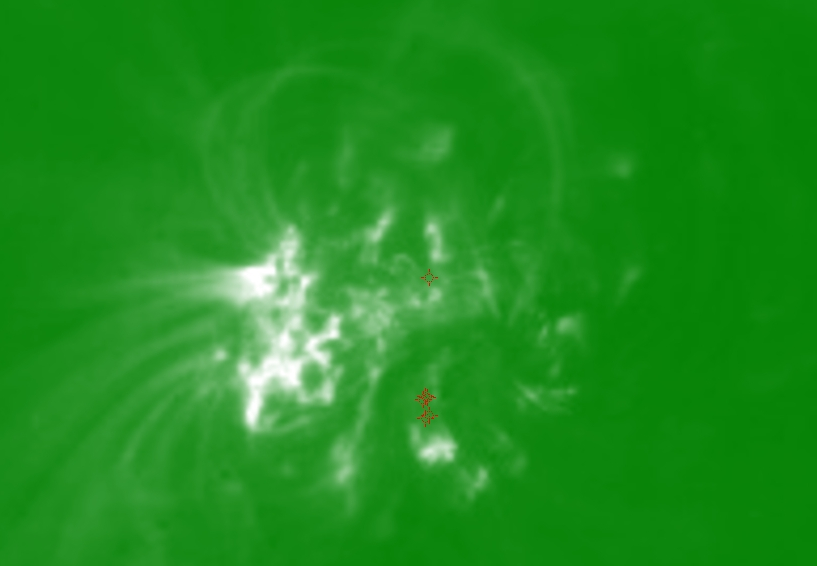
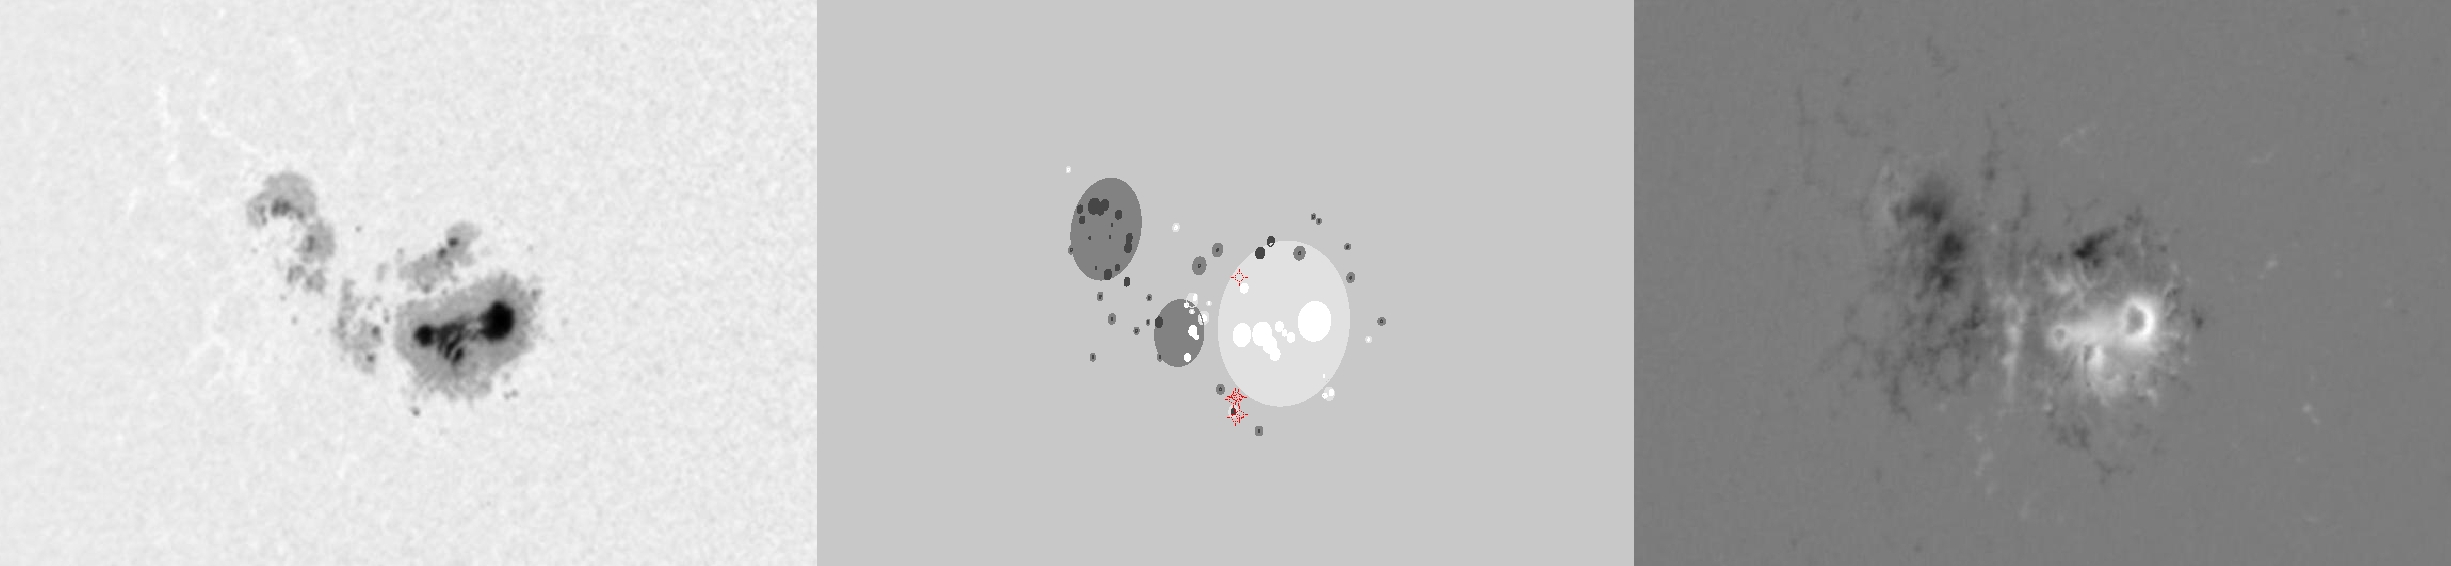
| Evolution of sunspot group NOAA 10652 and positions of flares in it animated by using the data of SOHO/MDI Debrecen Data (SDD) sunspot catalogue (lower panel, middle, ellipses with positions and areas corresponding to the relevant data of spots in SDD and with grey-scale colour coding of the magnetic polarities corresponding to that of the magnetograms), SOHO/MDI continuum images (lower panel, left) and magnetograms (lower panel, right), SOHO/EIT images (upper panel, middle), GOES and RHESSI flare data (red and blue symbols) observed within the interval around the time of SDD data. |
|
When you want to zoom in on one of the images, simply move the mouse pointer over that image. |
 |
| Year | Month | Day | Hour | Min | Sec | NOAA | Proj.U | Proj.WS | Corr.U | Corr.WS | B | L | LCM | Pos.angle | r | MU | MP |
|---|---|---|---|---|---|---|---|---|---|---|---|---|---|---|---|---|---|
| 2004 | 07 | 20 | 03 | 11 | 32 | 10652 | 426 | 3648 | 278 | 2416 | 8.55 | 347.62 | -41.60 | 82.63 | 0.6626 | 626.8 | 81.8 |
| Flare | Date | Start | Peak | End | Dur [s] | Peak [c/s] | Total Counts | Energy [keV] | X pos [asec] | Y pos [asec] | Radial [asec] | B [deg] | L [deg] | Flags |
|---|---|---|---|---|---|---|---|---|---|---|---|---|---|---|
| 4072066 | 20-Jul-2004 | 03:12:08 | 03:15:26 | 03:18:08 | 360 | 38 | 47088 | 6-12 | -614 | 24 | 615 | 5.08 | -11.36 | A0 DR P1 |
| 4072045 | 20-Jul-2004 | 03:18:08 | 03:22:14 | 03:27:04 | 536 | 48 | 95136 | 6-12 | -614 | 22 | 614 | 4.96 | -11.41 | A0 DR P1 PE |
| 4072091 | 20-Jul-2004 | 03:27:04 | 03:30:22 | 03:31:44 | 280 | 32 | 39552 | 6-12 | -609 | 23 | 610 | 5.04 | -11.11 | A0 DR P1 |
| 4072092 | 20-Jul-2004 | 03:34:32 | 03:34:54 | 03:35:48 | 76 | 26 | 9744 | 6-12 | -607 | 12 | 607 | 4.40 | -10.95 | A0 |
| 4072046 | 20-Jul-2004 | 03:37:00 | 03:44:54 | 03:47:40 | 640 | 120 | 239424 | 6-12 | -607 | 10 | 607 | 4.28 | -11.03 | A0 |
| 4072067 | 20-Jul-2004 | 03:56:56 | 03:57:50 | 03:59:24 | 148 | 56 | 27456 | 6-12 | -602 | 98 | 610 | 9.53 | -11.29 | A0 DR P1 |
| Date | Start | Peak | End | Classification | B [deg] | LCM [deg] |
|---|---|---|---|---|---|---|
| No data |

