
move the mouse pointer over that image.
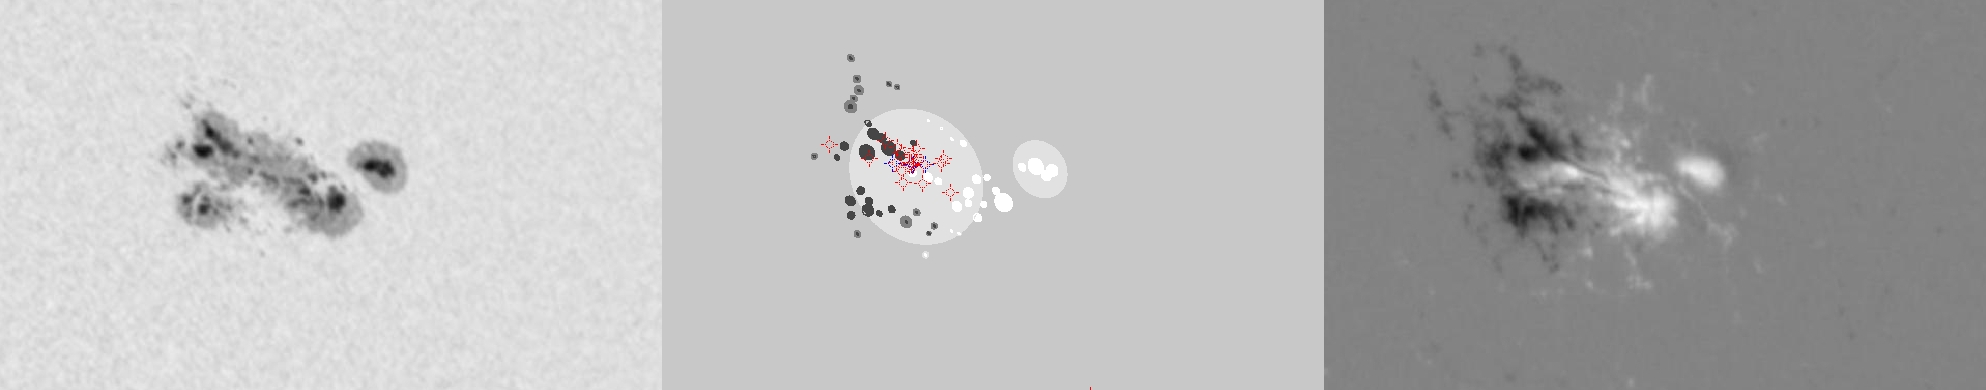
| Evolution of sunspot group NOAA 10564 and positions of flares in it animated by using the data of SOHO/MDI Debrecen Data (SDD) sunspot catalogue (lower panel, middle, ellipses with positions and areas corresponding to the relevant data of spots in SDD and with grey-scale colour coding of the magnetic polarities corresponding to that of the magnetograms), SOHO/MDI continuum images (lower panel, left) and magnetograms (lower panel, right), SOHO/EIT images (upper panel, middle), GOES and RHESSI flare data (red and blue symbols) observed within the interval around the time of SDD data. |
|
When you want to zoom in on one of the images, simply move the mouse pointer over that image. |
 |
| Year | Month | Day | Hour | Min | Sec | NOAA | Proj.U | Proj.WS | Corr.U | Corr.WS | B | L | LCM | Pos.angle | r | MU | MP |
|---|---|---|---|---|---|---|---|---|---|---|---|---|---|---|---|---|---|
| 2004 | 02 | 26 | 16 | 18 | 33 | 10564 | 312 | 2328 | 185 | 1353 | 13.55 | 161.78 | 23.76 | 311.47 | 0.5241 | 157.2 | 157.3 |
| Flare | Date | Start | Peak | End | Dur [s] | Peak [c/s] | Total Counts | Energy [keV] | X pos [asec] | Y pos [asec] | Radial [asec] | B [deg] | L [deg] | Flags |
|---|---|---|---|---|---|---|---|---|---|---|---|---|---|---|
| 4022613 | 26-Feb-2004 | 12:43:52 | 12:44:46 | 12:47:36 | 224 | 200 | 89856 | 6-12 | 340 | 323 | 470 | 12.95 | 160.45 | A0 ES P1 |
| 4022692 | 26-Feb-2004 | 12:47:36 | 12:52:26 | 12:55:48 | 492 | 880 | 700128 | 12-25 | 338 | 344 | 482 | 14.29 | 160.38 | A0 GE P1 PE |
| 4022665 | 26-Feb-2004 | 13:08:40 | 13:14:22 | 13:23:48 | 908 | 76 | 147768 | 6-12 | 343 | 341 | 484 | 14.11 | 160.49 | A0 DR GS P1 |
| 4022615 | 26-Feb-2004 | 13:32:36 | 13:38:34 | 13:45:36 | 780 | 1584 | 1497240 | 12-25 | 443 | 195 | 484 | 5.36 | 166.24 | A0 |
| 4022616 | 26-Feb-2004 | 14:19:52 | 14:20:38 | 14:31:36 | 704 | 384 | 152264 | 12-25 | 349 | 327 | 478 | 13.24 | 160.19 | a0 A1 DR ES P1 |
| 4022693 | 26-Feb-2004 | 14:31:36 | 14:35:02 | 14:38:16 | 400 | 5 | 5276 | 12-25 | 348 | 340 | 487 | 14.06 | 160.08 | A0 |
| 4022667 | 26-Feb-2004 | 14:38:16 | 14:39:46 | 14:41:08 | 172 | 1 | 875 | 6-12 | 355 | 339 | 491 | 14.02 | 160.49 | A0 |
| 4022668 | 26-Feb-2004 | 14:43:00 | 14:44:42 | 14:51:08 | 488 | 4 | 4434 | 12-25 | 339 | 340 | 481 | 14.03 | 159.39 | A0 |
| 4022694 | 26-Feb-2004 | 14:54:56 | 14:55:10 | 14:55:36 | 40 | 0 | 74 | 6-12 | 350 | 338 | 487 | 13.94 | 160.01 | A0 DR P1 |
| 4022669 | 26-Feb-2004 | 14:56:20 | 14:57:22 | 14:59:20 | 180 | 1 | 517 | 6-12 | 353 | 343 | 492 | 14.27 | 160.23 | A0 DR P1 |
| 4022670 | 26-Feb-2004 | 15:03:04 | 15:03:42 | 15:04:36 | 92 | 1 | 252 | 6-12 | 345 | 349 | 491 | 14.63 | 159.68 | A0 |
| 4022671 | 26-Feb-2004 | 15:07:36 | 15:09:30 | 15:11:56 | 260 | 1 | 791 | 6-12 | 349 | 346 | 491 | 14.45 | 159.87 | A0 |
| 4022695 | 26-Feb-2004 | 15:11:56 | 15:15:18 | 15:19:52 | 476 | 6 | 4695 | 12-25 | 357 | 339 | 493 | 14.03 | 160.30 | A0 |
| 4022620 | 26-Feb-2004 | 15:56:08 | 15:57:02 | 16:05:32 | 564 | 112 | 98280 | 6-12 | 369 | 337 | 500 | 13.94 | 160.71 | A0 DR P1 |
| 4022672 | 26-Feb-2004 | 16:05:32 | 16:07:42 | 16:12:08 | 396 | 46 | 45888 | 6-12 | 374 | 348 | 511 | 14.66 | 161.03 | A0 |
| 4022673 | 26-Feb-2004 | 16:14:16 | 16:14:46 | 16:18:32 | 256 | 32 | 27864 | 6-12 | 374 | 344 | 508 | 14.41 | 160.94 | A0 |
| 4022621 | 26-Feb-2004 | 16:21:48 | 16:26:10 | 16:32:08 | 620 | 2057 | 1653756 | 12-25 | 371 | 326 | 494 | 13.24 | 160.51 | A0 DF DR P1 |
| 4022622 | 26-Feb-2004 | 16:38:28 | 16:39:58 | 16:44:16 | 348 | 417 | 220604 | 12-25 | 374 | 333 | 501 | 13.70 | 160.63 | A0 DF DR P1 |
| 4022675 | 26-Feb-2004 | 17:34:52 | 17:35:54 | 17:37:48 | 176 | 43 | 25841 | 6-12 | 345 | 349 | 491 | 14.63 | 158.28 | A0 DF DR P1 |
| 4022623 | 26-Feb-2004 | 17:38:40 | 17:39:14 | 17:40:20 | 100 | 144 | 31261 | 12-25 | 370 | 340 | 503 | 14.13 | 159.86 | A0 DF DR P1 |
| 4022641 | 26-Feb-2004 | 17:49:28 | 17:50:14 | 17:51:20 | 112 | 98 | 28591 | 6-12 | 383 | 351 | 520 | 14.89 | 160.72 | A0 DF P1 |
| Date | Start | Peak | End | Classification | B [deg] | LCM [deg] |
|---|---|---|---|---|---|---|
| 26-Feb-2004 | 12:48 | 12:52 | 12:57 | B4.2 | 14 | 21 |
| 26-Feb-2004 | 13:34 | 13:39 | 13:42 | B5.1 | 14 | 22 |
| 26-Feb-2004 | 14:09 | 14:20 | 14:23 | C6.5 | 14 | 21 |
| 26-Feb-2004 | 16:21 | 16:26 | 16:28 | B7.8 | 14 | 23 |

