move the mouse pointer over that image.
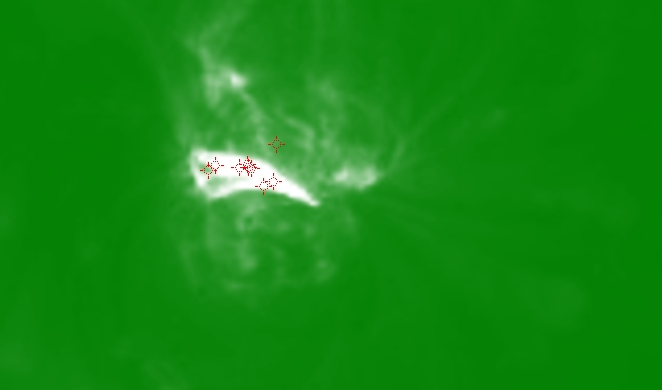
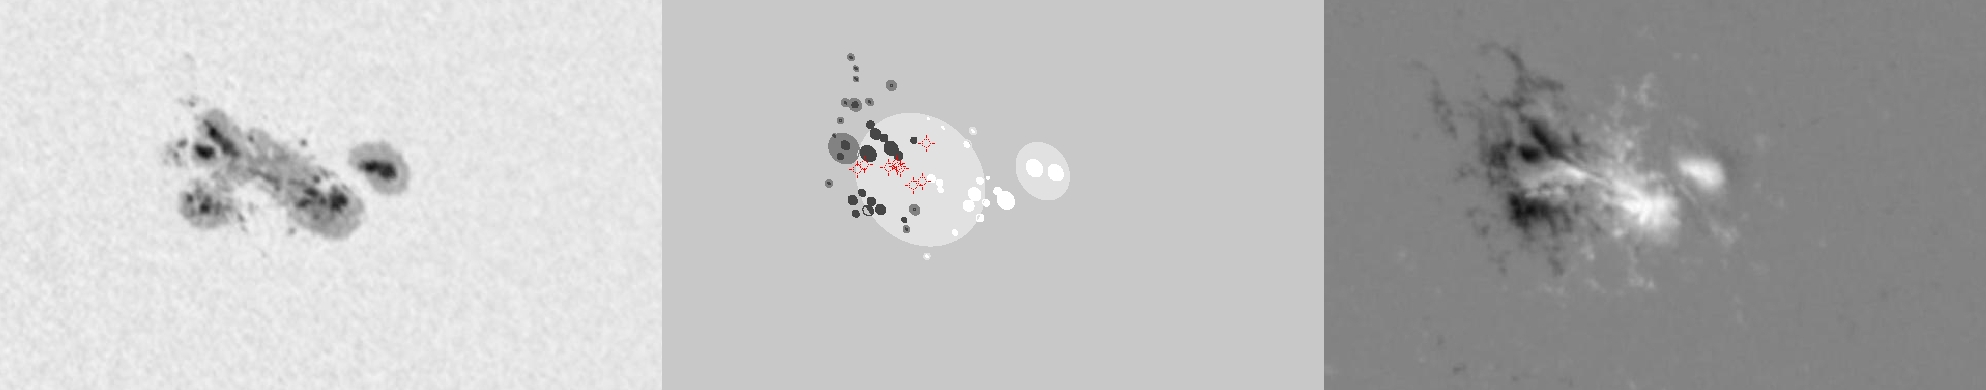
| Evolution of sunspot group NOAA 10564 and positions of flares in it animated by using the data of SOHO/MDI Debrecen Data (SDD) sunspot catalogue (lower panel, middle, ellipses with positions and areas corresponding to the relevant data of spots in SDD and with grey-scale colour coding of the magnetic polarities corresponding to that of the magnetograms), SOHO/MDI continuum images (lower panel, left) and magnetograms (lower panel, right), SOHO/EIT images (upper panel, middle), GOES and RHESSI flare data (red and blue symbols) observed within the interval around the time of SDD data. |
|
When you want to zoom in on one of the images, simply move the mouse pointer over that image. |
 |
| Year | Month | Day | Hour | Min | Sec | NOAA | Proj.U | Proj.WS | Corr.U | Corr.WS | B | L | LCM | Pos.angle | r | MU | MP |
|---|---|---|---|---|---|---|---|---|---|---|---|---|---|---|---|---|---|
| 2004 | 02 | 26 | 19 | 27 | 33 | 10564 | 313 | 2330 | 181 | 1374 | 13.54 | 161.71 | 25.43 | 309.53 | 0.5426 | 88.4 | 175.1 |
| Flare | Date | Start | Peak | End | Dur [s] | Peak [c/s] | Total Counts | Energy [keV] | X pos [asec] | Y pos [asec] | Radial [asec] | B [deg] | L [deg] | Flags |
|---|---|---|---|---|---|---|---|---|---|---|---|---|---|---|
| 4022642 | 26-Feb-2004 | 17:52:08 | 17:53:38 | 17:58:20 | 372 | 183 | 76111 | 6-12 | 382 | 351 | 519 | 14.88 | 160.63 | A0 DF P1 |
| 4022626 | 26-Feb-2004 | 17:58:20 | 18:06:18 | 18:15:08 | 1008 | 419 | 584831 | 12-25 | 383 | 327 | 504 | 13.35 | 160.40 | A0 DF DR P1 |
| 4022696 | 26-Feb-2004 | 18:16:52 | 18:17:22 | 18:18:32 | 100 | 26 | 13248 | 6-12 | 370 | 338 | 501 | 14.00 | 159.50 | A0 DR P1 |
| 4022677 | 26-Feb-2004 | 18:20:56 | 18:21:46 | 18:22:48 | 112 | 36 | 17472 | 6-12 | 372 | 336 | 501 | 13.88 | 159.58 | A0 DR P1 |
| 4022678 | 26-Feb-2004 | 18:30:36 | 18:31:22 | 18:33:16 | 160 | 30 | 21168 | 6-12 | 384 | 324 | 503 | 13.16 | 160.22 | A0 |
| 4022679 | 26-Feb-2004 | 19:24:12 | 19:26:50 | 19:37:08 | 776 | 160 | 213024 | 6-12 | 391 | 334 | 515 | 13.82 | 160.26 | A0 DF P1 |
| 4022643 | 26-Feb-2004 | 19:37:08 | 19:39:10 | 19:41:32 | 264 | 152 | 76512 | 6-12 | 372 | 336 | 502 | 13.88 | 158.87 | A0 DF DR P1 |
| 4022680 | 26-Feb-2004 | 19:41:32 | 19:43:14 | 19:44:16 | 164 | 56 | 36394 | 6-12 | 369 | 333 | 497 | 13.68 | 158.61 | A0 DF DR P1 |
| 4022629 | 26-Feb-2004 | 19:50:32 | 20:00:34 | 20:10:12 | 1180 | 2800 | 5532648 | 12-25 | 393 | 334 | 516 | 13.83 | 160.08 | A0 DR EE P1 |
| Date | Start | Peak | End | Classification | B [deg] | LCM [deg] |
|---|---|---|---|---|---|---|
| No data |

