move the mouse pointer over that image.
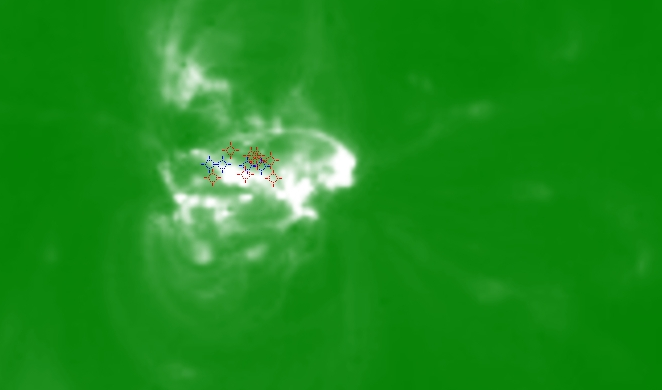
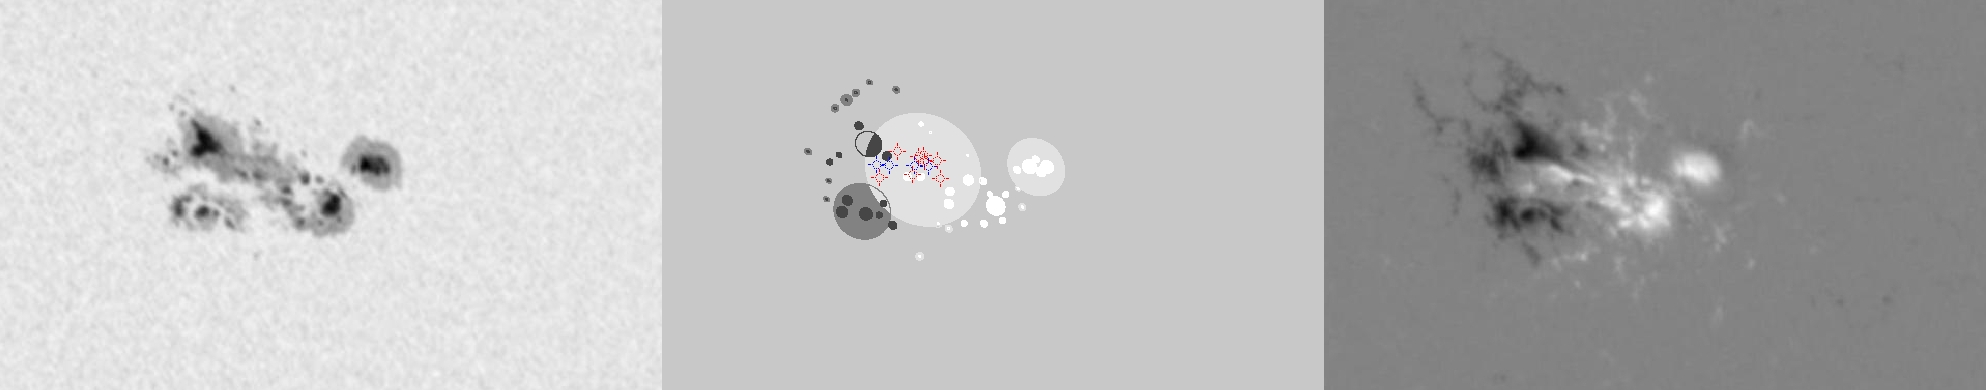
| Evolution of sunspot group NOAA 10564 and positions of flares in it animated by using the data of SOHO/MDI Debrecen Data (SDD) sunspot catalogue (lower panel, middle, ellipses with positions and areas corresponding to the relevant data of spots in SDD and with grey-scale colour coding of the magnetic polarities corresponding to that of the magnetograms), SOHO/MDI continuum images (lower panel, left) and magnetograms (lower panel, right), SOHO/EIT images (upper panel, middle), GOES and RHESSI flare data (red and blue symbols) observed within the interval around the time of SDD data. |
|
When you want to zoom in on one of the images, simply move the mouse pointer over that image. |
 |
| Year | Month | Day | Hour | Min | Sec | NOAA | Proj.U | Proj.WS | Corr.U | Corr.WS | B | L | LCM | Pos.angle | r | MU | MP |
|---|---|---|---|---|---|---|---|---|---|---|---|---|---|---|---|---|---|
| 2004 | 02 | 26 | 05 | 10 | 33 | 10564 | 310 | 2152 | 172 | 1203 | 13.57 | 161.97 | 17.85 | 319.71 | 0.4619 | 74.2 | 113.7 |
| Flare | Date | Start | Peak | End | Dur [s] | Peak [c/s] | Total Counts | Energy [keV] | X pos [asec] | Y pos [asec] | Radial [asec] | B [deg] | L [deg] | Flags |
|---|---|---|---|---|---|---|---|---|---|---|---|---|---|---|
| 4022601 | 26-Feb-2004 | 01:36:16 | 01:38:14 | 01:39:52 | 216 | 12 | 5919 | 12-25 | 242 | 347 | 423 | 14.24 | 160.33 | A0 DR P1 |
| 4022602 | 26-Feb-2004 | 01:42:04 | 01:46:06 | 01:49:08 | 424 | 9 | 9175 | 12-25 | 246 | 336 | 417 | 13.54 | 160.47 | A0 DR P1 |
| 4022686 | 26-Feb-2004 | 01:49:08 | 02:01:02 | 02:33:20 | 2652 | 19374 | 51414032 | 25-50 | 233 | 338 | 410 | 13.64 | 159.52 | a0 a1 A3 DR P1 PE |
| 4022605 | 26-Feb-2004 | 03:17:24 | 03:18:46 | 03:20:00 | 156 | 432 | 267264 | 12-25 | 259 | 349 | 435 | 14.40 | 160.51 | A0 DR P1 |
| 4022606 | 26-Feb-2004 | 03:28:04 | 03:37:14 | 03:47:08 | 1144 | 624 | 1619904 | 12-25 | 251 | 352 | 432 | 14.57 | 159.84 | A0 |
| 4022654 | 26-Feb-2004 | 03:54:40 | 03:55:34 | 03:58:24 | 224 | 104 | 90912 | 6-12 | 273 | 345 | 440 | 14.18 | 161.05 | A0 |
| 4022655 | 26-Feb-2004 | 03:58:24 | 04:00:22 | 04:01:28 | 184 | 68 | 59904 | 6-12 | 274 | 349 | 444 | 14.44 | 161.09 | A0 DR P1 |
| 4022636 | 26-Feb-2004 | 05:05:40 | 05:33:26 | 05:45:20 | 2380 | 144 | 351569 | 12-25 | 273 | 334 | 432 | 13.47 | 160.10 | a0 A1 DR P1 |
| Date | Start | Peak | End | Classification | B [deg] | LCM [deg] |
|---|---|---|---|---|---|---|
| 26-Feb-2004 | 00:59 | 01:07 | 01:15 | C1.8 | 14 | 14 |
| 26-Feb-2004 | 01:50 | 02:03 | 02:10 | X1.1 | 14 | 14 |
| 26-Feb-2004 | 04:41 | 04:49 | 04:57 | C1.6 | 14 | 17 |
| 26-Feb-2004 | 05:30 | 05:39 | 05:48 | C2.4 | 14 | 18 |

