move the mouse pointer over that image.
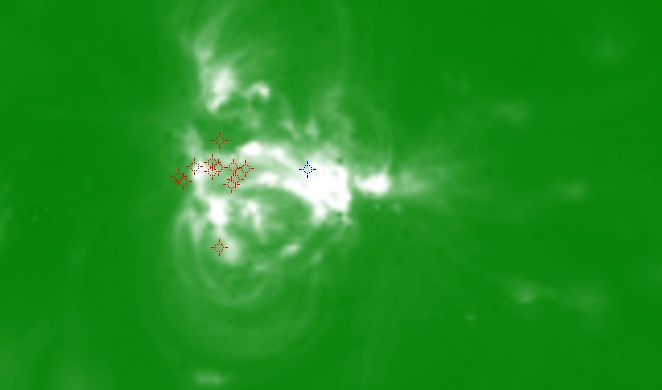
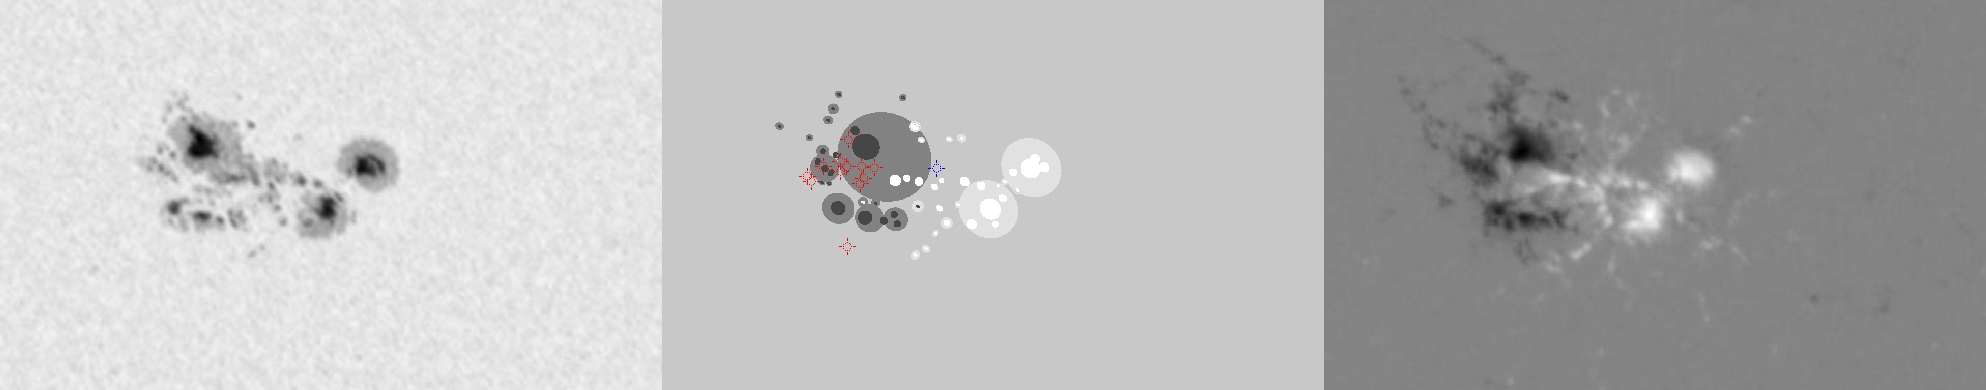
| Evolution of sunspot group NOAA 10564 and positions of flares in it animated by using the data of SOHO/MDI Debrecen Data (SDD) sunspot catalogue (lower panel, middle, ellipses with positions and areas corresponding to the relevant data of spots in SDD and with grey-scale colour coding of the magnetic polarities corresponding to that of the magnetograms), SOHO/MDI continuum images (lower panel, left) and magnetograms (lower panel, right), SOHO/EIT images (upper panel, middle), GOES and RHESSI flare data (red and blue symbols) observed within the interval around the time of SDD data. |
|
When you want to zoom in on one of the images, simply move the mouse pointer over that image. |
 |
| Year | Month | Day | Hour | Min | Sec | NOAA | Proj.U | Proj.WS | Corr.U | Corr.WS | B | L | LCM | Pos.angle | r | MU | MP |
|---|---|---|---|---|---|---|---|---|---|---|---|---|---|---|---|---|---|
| 2004 | 02 | 25 | 20 | 47 | 33 | 10564 | 310 | 2043 | 169 | 1113 | 13.62 | 161.90 | 13.18 | 328.06 | 0.4197 | 115.9 | 44.5 |
| Flare | Date | Start | Peak | End | Dur [s] | Peak [c/s] | Total Counts | Energy [keV] | X pos [asec] | Y pos [asec] | Radial [asec] | B [deg] | L [deg] | Flags |
|---|---|---|---|---|---|---|---|---|---|---|---|---|---|---|
| 4022539 | 25-Feb-2004 | 19:48:44 | 20:08:26 | 20:09:16 | 1232 | 720 | 1524720 | 12-25 | 175 | 345 | 387 | 13.99 | 159.12 | A0 DR EE P1 PE |
| 4022573 | 25-Feb-2004 | 21:11:04 | 21:12:34 | 21:16:28 | 324 | 22 | 28128 | 6-12 | 185 | 294 | 347 | 10.78 | 159.01 | A0 |
| 4022574 | 25-Feb-2004 | 21:24:12 | 21:29:02 | 21:39:04 | 892 | 42 | 122232 | 6-12 | 189 | 344 | 393 | 13.95 | 159.25 | A0 DR P1 PE |
| 4022575 | 25-Feb-2004 | 22:19:36 | 22:20:18 | 22:25:20 | 344 | 2 | 2556 | 6-12 | 221 | 343 | 408 | 13.94 | 160.79 | A0 DR P1 |
| 40225100 | 25-Feb-2004 | 22:25:20 | 22:27:02 | 22:36:16 | 656 | 3 | 3443 | 6-12 | 202 | 341 | 396 | 13.78 | 159.53 | A0 DR P1 PE |
| 40225101 | 25-Feb-2004 | 22:36:16 | 22:40:02 | 22:48:20 | 724 | 0 | 1365 | 6-12 | 218 | 333 | 398 | 13.30 | 160.39 | A0 |
| 4022527 | 25-Feb-2004 | 22:52:32 | 23:11:26 | 23:21:20 | 1728 | 128 | 342992 | 12-25 | 229 | 336 | 407 | 13.51 | 160.81 | a0 A1 DR EE P1 PE |
| 40225102 | 25-Feb-2004 | 23:56:08 | 23:59:14 | 00:05:08 | 540 | 26 | 55848 | 6-12 | 233 | 360 | 429 | 15.05 | 160.72 | A0 DR P1 |
| 4022649 | 26-Feb-2004 | 00:05:08 | 00:07:18 | 00:11:32 | 384 | 30 | 43944 | 6-12 | 231 | 346 | 417 | 14.15 | 160.46 | A0 DR P1 |
| 4022650 | 26-Feb-2004 | 00:11:32 | 00:17:14 | 00:27:52 | 980 | 48 | 134328 | 6-12 | 216 | 334 | 398 | 13.35 | 159.38 | A0 |
| 4022651 | 26-Feb-2004 | 00:43:08 | 00:43:42 | 00:46:52 | 224 | 38 | 25824 | 6-12 | 221 | 337 | 404 | 13.55 | 159.46 | A0 DR P1 |
| 4022652 | 26-Feb-2004 | 00:50:08 | 00:51:50 | 00:54:44 | 276 | 24 | 29016 | 6-12 | 233 | 343 | 415 | 13.96 | 160.17 | A0 DR P1 |
| Date | Start | Peak | End | Classification | B [deg] | LCM [deg] |
|---|---|---|---|---|---|---|
| 25-Feb-2004 | 23:06 | 23:15 | 23:27 | C2.6 | 14 | 15 |

