move the mouse pointer over that image.
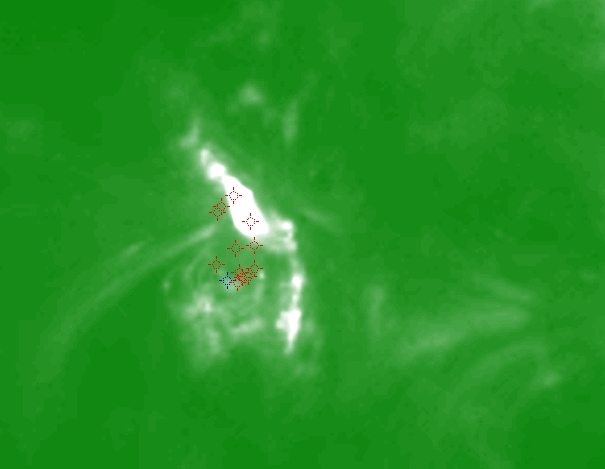
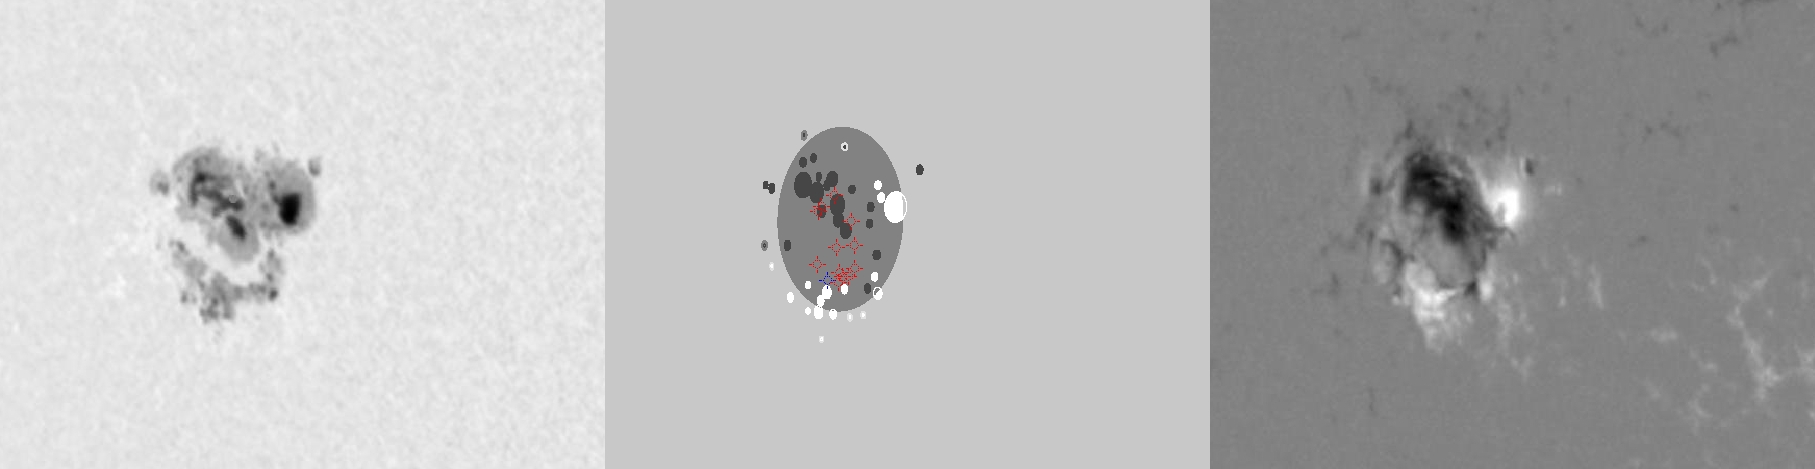
| Evolution of sunspot group NOAA 10484 and positions of flares in it animated by using the data of SOHO/MDI Debrecen Data (SDD) sunspot catalogue (lower panel, middle, ellipses with positions and areas corresponding to the relevant data of spots in SDD and with grey-scale colour coding of the magnetic polarities corresponding to that of the magnetograms), SOHO/MDI continuum images (lower panel, left) and magnetograms (lower panel, right), SOHO/EIT images (upper panel, middle), GOES and RHESSI flare data (red and blue symbols) observed within the interval around the time of SDD data. |
|
When you want to zoom in on one of the images, simply move the mouse pointer over that image. |
 |
| Year | Month | Day | Hour | Min | Sec | NOAA | Proj.U | Proj.WS | Corr.U | Corr.WS | B | L | LCM | Pos.angle | r | MU | MP |
|---|---|---|---|---|---|---|---|---|---|---|---|---|---|---|---|---|---|
| 2003 | 10 | 20 | 06 | 45 | 33 | 10484 | 411 | 2471 | 303 | 1818 | 5.28 | 355.23 | -47.92 | 87.80 | 0.7417 | -229.6 | -20.9 |
| Flare | Date | Start | Peak | End | Dur [s] | Peak [c/s] | Total Counts | Energy [keV] | X pos [asec] | Y pos [asec] | Radial [asec] | B [deg] | L [deg] | Flags |
|---|---|---|---|---|---|---|---|---|---|---|---|---|---|---|
| 3102007 | 20-Oct-2003 | 04:07:32 | 04:11:06 | 04:21:36 | 844 | 120 | 178992 | 12-25 | -720 | 12 | 721 | 4.41 | -5.18 | A0 DF DR P1 |
| 31020139 | 20-Oct-2003 | 04:21:36 | 04:25:54 | 04:27:04 | 328 | 28 | 41304 | 6-12 | -728 | 10 | 728 | 4.24 | -6.03 | A0 DF DR P1 PE |
| 31020140 | 20-Oct-2003 | 04:27:04 | 04:29:10 | 04:33:12 | 368 | 40 | 55872 | 6-12 | -720 | -8 | 720 | 3.22 | -5.25 | A0 DF DR P1 PE |
| 31020116 | 20-Oct-2003 | 04:33:12 | 04:34:58 | 04:41:28 | 496 | 36 | 60072 | 6-12 | -715 | -3 | 715 | 3.55 | -4.88 | A0 DF DR P1 PE |
| 31020117 | 20-Oct-2003 | 04:43:44 | 04:46:18 | 04:47:56 | 252 | 34 | 25944 | 6-12 | -722 | -6 | 722 | 3.33 | -5.60 | A0 DF DR P1 |
| 31020118 | 20-Oct-2003 | 04:49:36 | 04:50:10 | 04:51:00 | 84 | 24 | 9792 | 6-12 | -714 | 26 | 714 | 5.28 | -5.08 | A0 DF P1 |
| 3102081 | 20-Oct-2003 | 05:27:16 | 05:30:10 | 05:32:32 | 316 | 8 | 6091 | 6-12 | -714 | -13 | 714 | 2.96 | -5.26 | A0 DF P1 |
| 3102008 | 20-Oct-2003 | 05:44:00 | 05:45:38 | 05:50:36 | 396 | 416 | 324336 | 12-25 | -708 | -10 | 708 | 3.18 | -4.88 | A0 a1 DF P1 |
| 31020119 | 20-Oct-2003 | 05:50:36 | 05:53:02 | 05:58:16 | 460 | 288 | 246240 | 12-25 | -712 | 41 | 713 | 6.18 | -5.57 | A0 DF DR P1 |
| 31020120 | 20-Oct-2003 | 05:58:16 | 06:06:26 | 06:14:20 | 964 | 144 | 373728 | 6-12 | -717 | 34 | 718 | 5.73 | -6.09 | A0 DF DR P1 PE |
| 31020122 | 20-Oct-2003 | 06:14:20 | 06:25:58 | 06:28:00 | 820 | 112 | 233040 | 6-12 | -716 | -3 | 716 | 3.54 | -5.98 | A0 DF DR EE P1 PE |
| 3102009 | 20-Oct-2003 | 07:03:00 | 07:12:18 | 08:03:08 | 3608 | 1968 | 10923789 | 12-25 | -706 | 29 | 707 | 5.50 | -5.68 | a0 A1 DF DR P1 PE |
| Date | Start | Peak | End | Classification | B [deg] | LCM [deg] |
|---|---|---|---|---|---|---|
| 20-Oct-2003 | 06:45 | 07:22 | 07:43 | M1.9 | 03 | -48 |

