move the mouse pointer over that image.
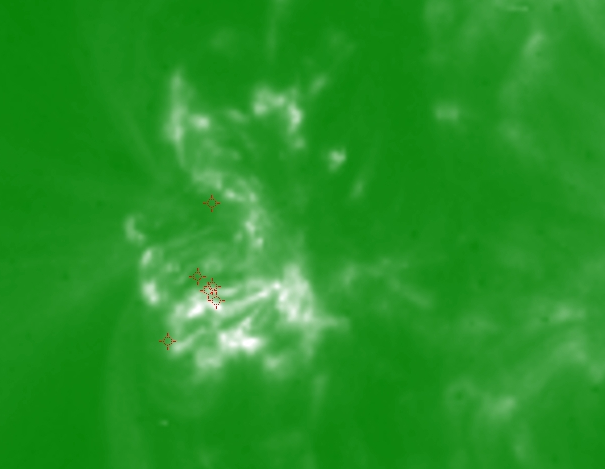
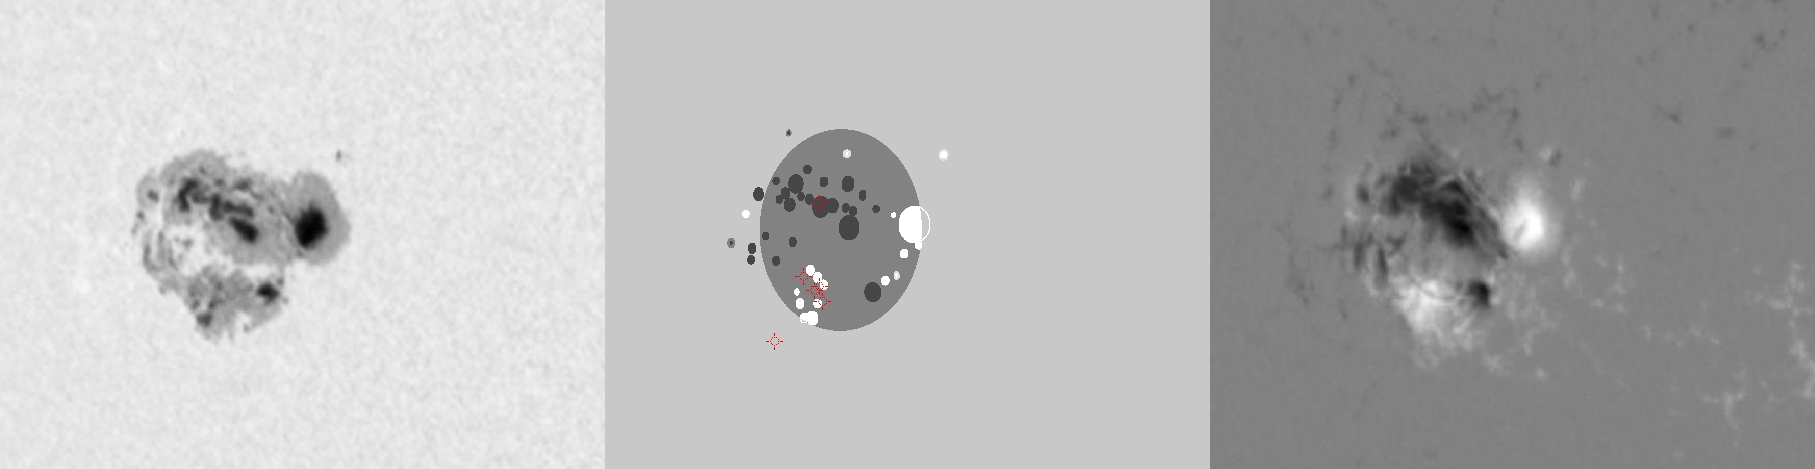
| Evolution of sunspot group NOAA 10484 and positions of flares in it animated by using the data of SOHO/MDI Debrecen Data (SDD) sunspot catalogue (lower panel, middle, ellipses with positions and areas corresponding to the relevant data of spots in SDD and with grey-scale colour coding of the magnetic polarities corresponding to that of the magnetograms), SOHO/MDI continuum images (lower panel, left) and magnetograms (lower panel, right), SOHO/EIT images (upper panel, middle), GOES and RHESSI flare data (red and blue symbols) observed within the interval around the time of SDD data. |
|
When you want to zoom in on one of the images, simply move the mouse pointer over that image. |
 |
| Year | Month | Day | Hour | Min | Sec | NOAA | Proj.U | Proj.WS | Corr.U | Corr.WS | B | L | LCM | Pos.angle | r | MU | MP |
|---|---|---|---|---|---|---|---|---|---|---|---|---|---|---|---|---|---|
| 2003 | 10 | 21 | 01 | 35 | 33 | 10484 | 534 | 3466 | 331 | 2158 | 4.96 | 355.37 | -37.44 | 88.86 | 0.6078 | -237.8 | -8.5 |
| Flare | Date | Start | Peak | End | Dur [s] | Peak [c/s] | Total Counts | Energy [keV] | X pos [asec] | Y pos [asec] | Radial [asec] | B [deg] | L [deg] | Flags |
|---|---|---|---|---|---|---|---|---|---|---|---|---|---|---|
| 31021106 | 21-Oct-2003 | 00:47:24 | 00:49:22 | 00:56:56 | 572 | 192 | 267984 | 12-25 | -590 | -35 | 591 | 2.27 | -5.71 | A0 DF P1 |
| 3102101 | 21-Oct-2003 | 00:56:56 | 00:58:26 | 01:02:40 | 344 | 44 | 68976 | 6-12 | -590 | -26 | 591 | 2.81 | -5.81 | A0 DF P1 |
| 3102184 | 21-Oct-2003 | 01:02:40 | 01:09:14 | 01:17:52 | 912 | 100 | 354624 | 6-12 | -588 | 26 | 589 | 5.91 | -5.94 | A0 DF DR P1 PE |
| 3102185 | 21-Oct-2003 | 01:17:52 | 01:29:18 | 01:34:32 | 1000 | 384 | 1040256 | 12-25 | -611 | -61 | 614 | .62 | -7.64 | A0 DF DR P1 PE |
| 3102155 | 21-Oct-2003 | 01:34:32 | 01:35:22 | 01:41:08 | 396 | 144 | 240528 | 6-12 | -584 | -29 | 585 | 2.65 | -5.69 | A0 DF P1 PE |
| 3102156 | 21-Oct-2003 | 02:16:40 | 02:16:46 | 02:23:04 | 384 | 3 | 3674 | 6-12 | -581 | -21 | 582 | 3.14 | -5.86 | A0 DF P1 |
| Date | Start | Peak | End | Classification | B [deg] | LCM [deg] |
|---|---|---|---|---|---|---|
| No data |

