move the mouse pointer over that image.
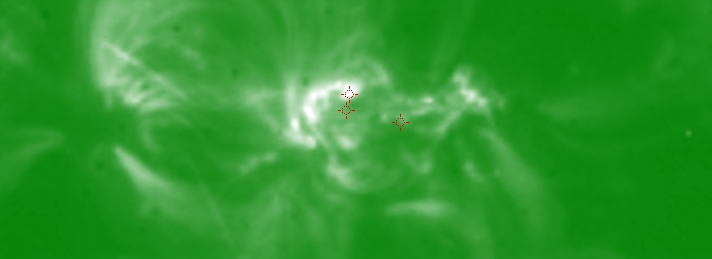
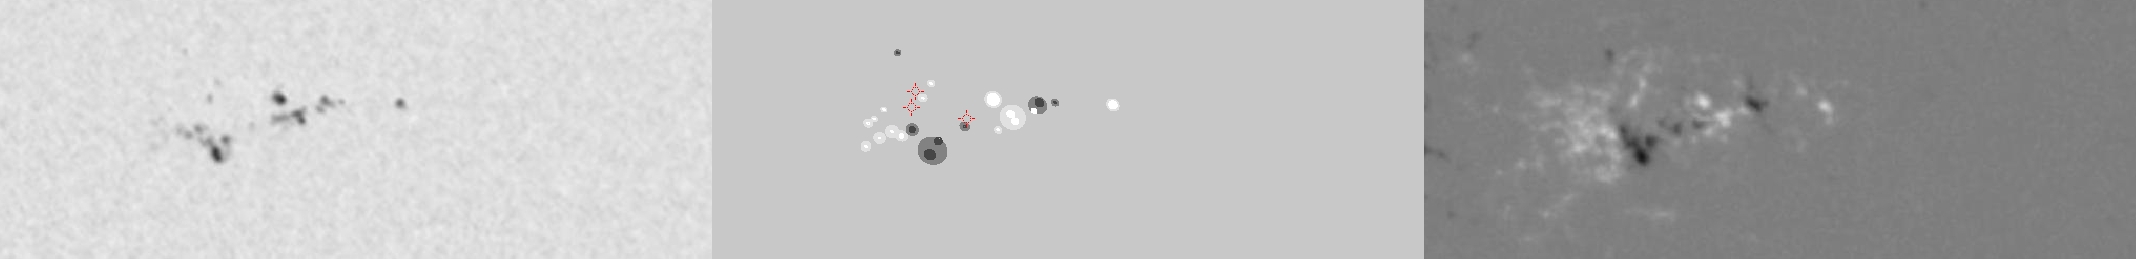
| Evolution of sunspot group NOAA 10338 and positions of flares in it animated by using the data of SOHO/MDI Debrecen Data (SDD) sunspot catalogue (lower panel, middle, ellipses with positions and areas corresponding to the relevant data of spots in SDD and with grey-scale colour coding of the magnetic polarities corresponding to that of the magnetograms), SOHO/MDI continuum images (lower panel, left) and magnetograms (lower panel, right), SOHO/EIT images (upper panel, middle), GOES and RHESSI flare data (red and blue symbols) observed within the interval around the time of SDD data. |
|
When you want to zoom in on one of the images, simply move the mouse pointer over that image. |
 |
| Year | Month | Day | Hour | Min | Sec | NOAA | Proj.U | Proj.WS | Corr.U | Corr.WS | B | L | LCM | Pos.angle | r | MU | MP |
|---|---|---|---|---|---|---|---|---|---|---|---|---|---|---|---|---|---|
| 2003 | 04 | 22 | 11 | 11 | 33 | 10338 | 67 | 336 | 38 | 186 | 17.90 | 285.52 | 12.13 | 332.99 | 0.4394 | 130.7 | 118.5 |
| Flare | Date | Start | Peak | End | Dur [s] | Peak [c/s] | Total Counts | Energy [keV] | X pos [asec] | Y pos [asec] | Radial [asec] | B [deg] | L [deg] | Flags |
|---|---|---|---|---|---|---|---|---|---|---|---|---|---|---|
| 3042239 | 22-Apr-2003 | 10:27:20 | 10:29:14 | 10:30:36 | 196 | 46 | 31440 | 6-12 | 200 | 379 | 428 | 18.19 | 285.32 | A0 DF P1 |
| 3042240 | 22-Apr-2003 | 10:44:00 | 10:58:18 | 11:14:40 | 1840 | 160 | 1023144 | 6-12 | 174 | 386 | 424 | 18.62 | 283.41 | A0 DF P1 |
| 3042279 | 22-Apr-2003 | 11:14:40 | 11:19:02 | 11:20:28 | 348 | 128 | 187176 | 6-12 | 182 | 396 | 436 | 19.28 | 283.78 | A0 DF P1 |
| Date | Start | Peak | End | Classification | B [deg] | LCM [deg] |
|---|---|---|---|---|---|---|
| No data |

