move the mouse pointer over that image.
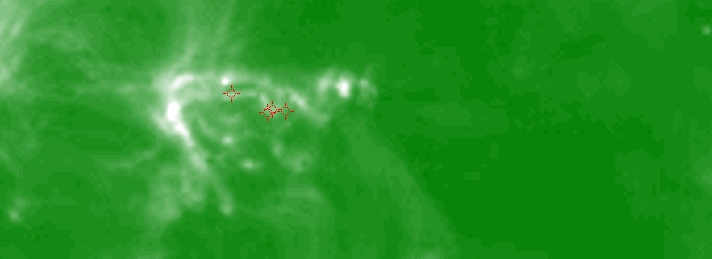
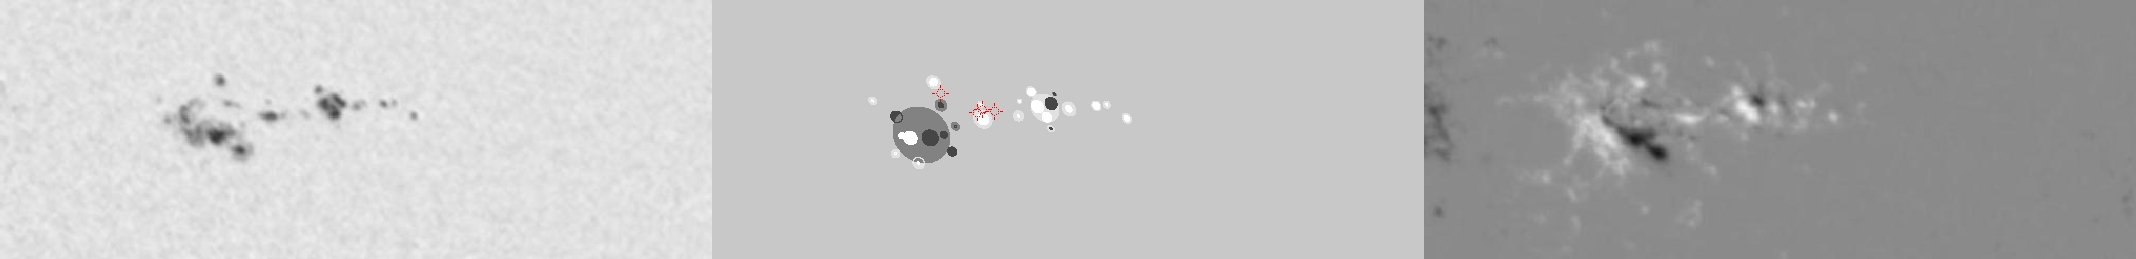
| Evolution of sunspot group NOAA 10338 and positions of flares in it animated by using the data of SOHO/MDI Debrecen Data (SDD) sunspot catalogue (lower panel, middle, ellipses with positions and areas corresponding to the relevant data of spots in SDD and with grey-scale colour coding of the magnetic polarities corresponding to that of the magnetograms), SOHO/MDI continuum images (lower panel, left) and magnetograms (lower panel, right), SOHO/EIT images (upper panel, middle), GOES and RHESSI flare data (red and blue symbols) observed within the interval around the time of SDD data. |
|
When you want to zoom in on one of the images, simply move the mouse pointer over that image. |
 |
| Year | Month | Day | Hour | Min | Sec | NOAA | Proj.U | Proj.WS | Corr.U | Corr.WS | B | L | LCM | Pos.angle | r | MU | MP |
|---|---|---|---|---|---|---|---|---|---|---|---|---|---|---|---|---|---|
| 2003 | 04 | 23 | 06 | 48 | 33 | 10338 | 159 | 590 | 92 | 346 | 17.84 | 284.77 | 22.18 | 316.92 | 0.5266 | 59.9 | 176.9 |
| Flare | Date | Start | Peak | End | Dur [s] | Peak [c/s] | Total Counts | Energy [keV] | X pos [asec] | Y pos [asec] | Radial [asec] | B [deg] | L [deg] | Flags |
|---|---|---|---|---|---|---|---|---|---|---|---|---|---|---|
| 3042328 | 23-Apr-2003 | 02:56:40 | 02:58:02 | 02:59:56 | 196 | 1 | 732 | 6-12 | 310 | 378 | 489 | 18.38 | 283.45 | A0 DF P1 |
| 3042373 | 23-Apr-2003 | 02:59:56 | 03:01:50 | 03:04:20 | 264 | 1 | 994 | 6-12 | 314 | 380 | 493 | 18.51 | 283.70 | A0 DF P1 |
| 3042334 | 23-Apr-2003 | 06:06:44 | 06:07:54 | 06:12:20 | 336 | 46 | 65088 | 6-12 | 372 | 377 | 530 | 18.47 | 285.92 | A0 DF P1 |
| 3042338 | 23-Apr-2003 | 06:29:04 | 06:29:42 | 06:31:48 | 164 | 52 | 40896 | 6-12 | 344 | 388 | 519 | 19.12 | 283.90 | A0 DF P1 |
| Date | Start | Peak | End | Classification | B [deg] | LCM [deg] |
|---|---|---|---|---|---|---|
| No data |

