move the mouse pointer over that image.
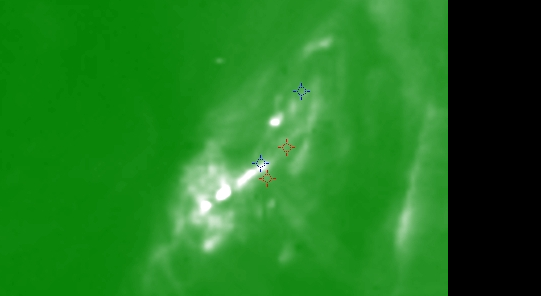
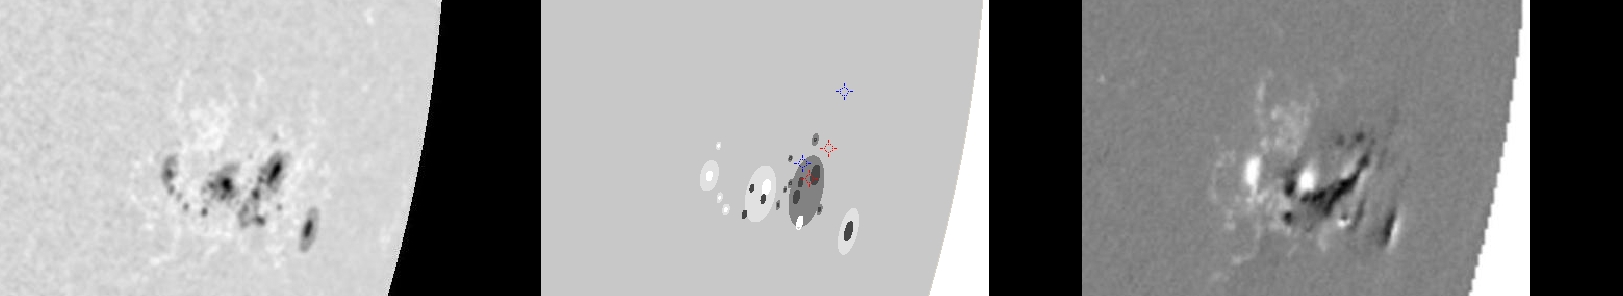
| Evolution of sunspot group NOAA 10314 and positions of flares in it animated by using the data of SOHO/MDI Debrecen Data (SDD) sunspot catalogue (lower panel, middle, ellipses with positions and areas corresponding to the relevant data of spots in SDD and with grey-scale colour coding of the magnetic polarities corresponding to that of the magnetograms), SOHO/MDI continuum images (lower panel, left) and magnetograms (lower panel, right), SOHO/EIT images (upper panel, middle), GOES and RHESSI flare data (red and blue symbols) observed within the interval around the time of SDD data. |
|
When you want to zoom in on one of the images, simply move the mouse pointer over that image. |
 |
| Year | Month | Day | Hour | Min | Sec | NOAA | Proj.U | Proj.WS | Corr.U | Corr.WS | B | L | LCM | Pos.angle | r | MU | MP |
|---|---|---|---|---|---|---|---|---|---|---|---|---|---|---|---|---|---|
| 2003 | 03 | 19 | 18 | 59 | 33 | 10314 | 83 | 585 | 95 | 659 | -15.18 | 62.23 | 64.76 | 256.51 | 0.8977 | -41.5 | 23.8 |
| Flare | Date | Start | Peak | End | Dur [s] | Peak [c/s] | Total Counts | Energy [keV] | X pos [asec] | Y pos [asec] | Radial [asec] | B [deg] | L [deg] | Flags |
|---|---|---|---|---|---|---|---|---|---|---|---|---|---|---|
| 3031956 | 19-Mar-2003 | 18:22:44 | 18:27:02 | 18:38:32 | 948 | 27 | 65339 | 6-12 | 856 | -171 | 873 | -13.19 | 423.16 | A0 DF DR ES P1 |
| 3031924 | 19-Mar-2003 | 18:42:00 | 18:50:26 | 19:01:32 | 1172 | 464 | 1093303 | 12-25 | 847 | -191 | 869 | -14.49 | 422.30 | a0 A1 DF GE P1 PE |
| Date | Start | Peak | End | Classification | B [deg] | LCM [deg] |
|---|---|---|---|---|---|---|
| 19-Mar-2003 | 18:02 | 18:21 | 18:34 | C1.3 | -11 | 66 |
| 19-Mar-2003 | 18:45 | 18:54 | 19:04 | C6.3 | -14 | 64 |

