move the mouse pointer over that image.
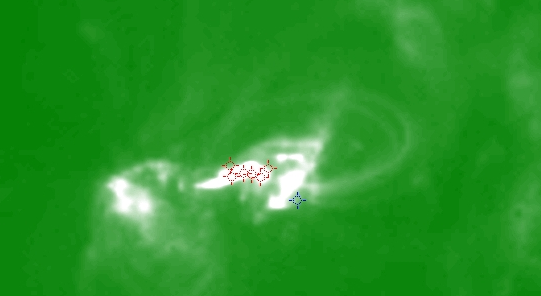
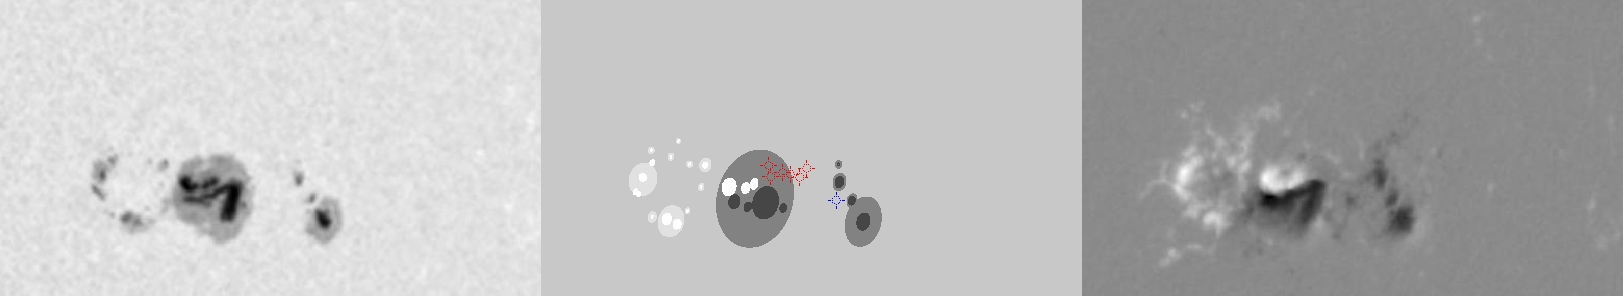
| Evolution of sunspot group NOAA 10314 and positions of flares in it animated by using the data of SOHO/MDI Debrecen Data (SDD) sunspot catalogue (lower panel, middle, ellipses with positions and areas corresponding to the relevant data of spots in SDD and with grey-scale colour coding of the magnetic polarities corresponding to that of the magnetograms), SOHO/MDI continuum images (lower panel, left) and magnetograms (lower panel, right), SOHO/EIT images (upper panel, middle), GOES and RHESSI flare data (red and blue symbols) observed within the interval around the time of SDD data. |
|
When you want to zoom in on one of the images, simply move the mouse pointer over that image. |
 |
| Year | Month | Day | Hour | Min | Sec | NOAA | Proj.U | Proj.WS | Corr.U | Corr.WS | B | L | LCM | Pos.angle | r | MU | MP |
|---|---|---|---|---|---|---|---|---|---|---|---|---|---|---|---|---|---|
| 2003 | 03 | 18 | 01 | 35 | 33 | 10314 | 233 | 1236 | 153 | 815 | -15.26 | 61.44 | 41.24 | 254.90 | 0.6600 | -491.7 | -139.0 |
| Flare | Date | Start | Peak | End | Dur [s] | Peak [c/s] | Total Counts | Energy [keV] | X pos [asec] | Y pos [asec] | Radial [asec] | B [deg] | L [deg] | Flags |
|---|---|---|---|---|---|---|---|---|---|---|---|---|---|---|
| 30318116 | 18-Mar-2003 | 01:11:12 | 01:12:46 | 01:18:16 | 424 | 3 | 4280 | 6-12 | 642 | -146 | 658 | -13.95 | 63.03 | A0 DF P1 |
| 30318117 | 18-Mar-2003 | 01:26:08 | 01:27:18 | 01:28:16 | 128 | 2 | 578 | 6-12 | 635 | -150 | 653 | -14.24 | 62.37 | A0 DF DR P1 |
| 3031890 | 18-Mar-2003 | 01:30:20 | 01:33:06 | 01:37:08 | 408 | 3 | 3333 | 6-12 | 642 | -152 | 660 | -14.31 | 62.92 | A0 DF P1 PE |
| 3031865 | 18-Mar-2003 | 01:37:08 | 01:41:38 | 01:43:32 | 384 | 152 | 73291 | 12-25 | 626 | -152 | 645 | -14.42 | 61.53 | a0 A1 DF EE GE P1 PE |
| 3031802 | 18-Mar-2003 | 02:18:52 | 02:23:14 | 02:27:20 | 508 | 46 | 63094 | 6-12 | 634 | -146 | 650 | -14.01 | 61.72 | A0 a1 DF P1 |
| 30318118 | 18-Mar-2003 | 02:27:20 | 02:31:18 | 02:34:52 | 452 | 44 | 66255 | 12-25 | 644 | -151 | 661 | -14.23 | 62.54 | A0 DF P1 |
| Date | Start | Peak | End | Classification | B [deg] | LCM [deg] |
|---|---|---|---|---|---|---|
| 18-Mar-2003 | 01:39 | 01:53 | 02:06 | C4.7 | -15 | 45 |

