move the mouse pointer over that image.
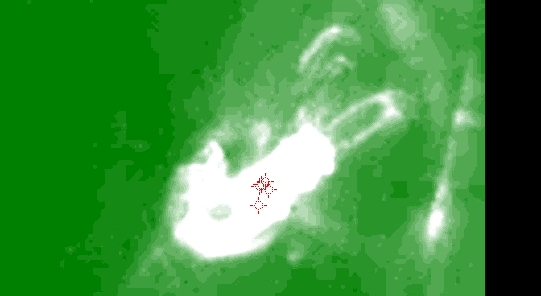
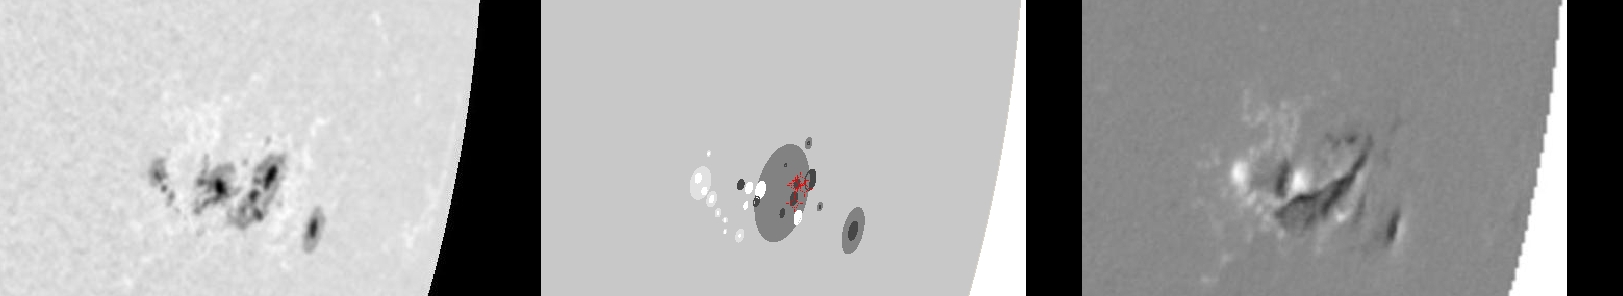
| Evolution of sunspot group NOAA 10314 and positions of flares in it animated by using the data of SOHO/MDI Debrecen Data (SDD) sunspot catalogue (lower panel, middle, ellipses with positions and areas corresponding to the relevant data of spots in SDD and with grey-scale colour coding of the magnetic polarities corresponding to that of the magnetograms), SOHO/MDI continuum images (lower panel, left) and magnetograms (lower panel, right), SOHO/EIT images (upper panel, middle), GOES and RHESSI flare data (red and blue symbols) observed within the interval around the time of SDD data. |
|
When you want to zoom in on one of the images, simply move the mouse pointer over that image. |
 |
| Year | Month | Day | Hour | Min | Sec | NOAA | Proj.U | Proj.WS | Corr.U | Corr.WS | B | L | LCM | Pos.angle | r | MU | MP |
|---|---|---|---|---|---|---|---|---|---|---|---|---|---|---|---|---|---|
| 2003 | 03 | 19 | 12 | 47 | 33 | 10314 | 122 | 748 | 122 | 744 | -15.22 | 61.85 | 60.98 | 256.48 | 0.8682 | -133.2 | 13.4 |
| Flare | Date | Start | Peak | End | Dur [s] | Peak [c/s] | Total Counts | Energy [keV] | X pos [asec] | Y pos [asec] | Radial [asec] | B [deg] | L [deg] | Flags |
|---|---|---|---|---|---|---|---|---|---|---|---|---|---|---|
| 3031997 | 19-Mar-2003 | 12:18:12 | 12:20:58 | 12:21:04 | 172 | 52 | 25152 | 6-12 | 819 | -190 | 841 | -14.84 | 62.12 | A0 DF P1 Q2 |
| 3031968 | 19-Mar-2003 | 12:45:52 | 12:49:22 | 12:51:44 | 352 | 160 | 149808 | 6-12 | 821 | -186 | 842 | -14.58 | 62.00 | A0 DF DR GS P1 |
| 3031999 | 19-Mar-2003 | 12:51:44 | 12:53:38 | 12:54:20 | 156 | 80 | 58080 | 6-12 | 818 | -189 | 840 | -14.79 | 421.67 | A0 DF DR P1 |
| 3031917 | 19-Mar-2003 | 12:54:20 | 12:58:46 | 12:59:20 | 300 | 288 | 199248 | 12-25 | 820 | -188 | 842 | -14.71 | 421.84 | A0 DF DR P1 |
| 3031918 | 19-Mar-2003 | 13:34:16 | 13:34:54 | 13:41:56 | 460 | 336 | 213523 | 6-12 | 823 | -202 | 848 | -15.48 | 422.31 | a0 A1 DF DR ES P1 PE |
| Date | Start | Peak | End | Classification | B [deg] | LCM [deg] |
|---|---|---|---|---|---|---|
| 19-Mar-2003 | 13:25 | 13:32 | 13:38 | M1.4 | -07 | 61 |

