move the mouse pointer over that image.
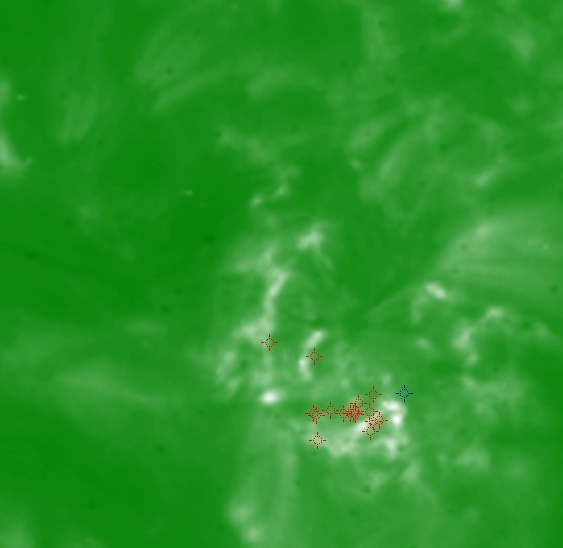
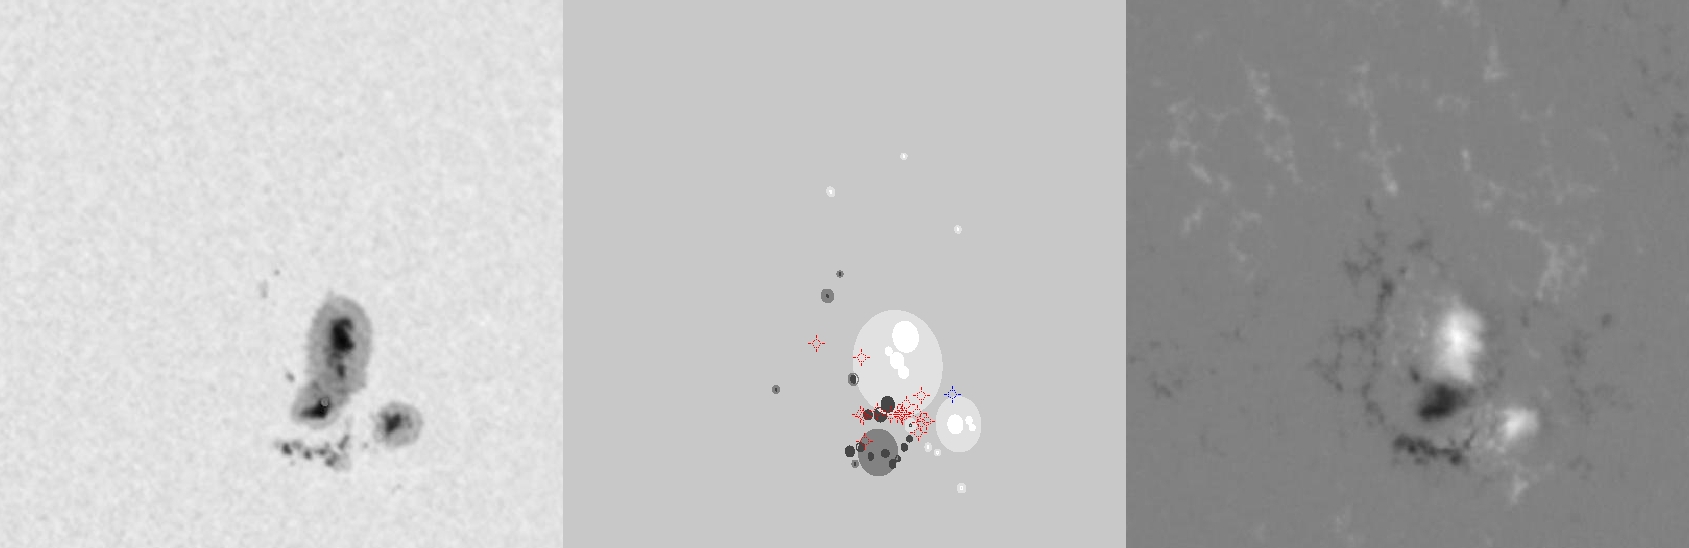
| Evolution of sunspot group NOAA 10139 and positions of flares in it animated by using the data of SOHO/MDI Debrecen Data (SDD) sunspot catalogue (lower panel, middle, ellipses with positions and areas corresponding to the relevant data of spots in SDD and with grey-scale colour coding of the magnetic polarities corresponding to that of the magnetograms), SOHO/MDI continuum images (lower panel, left) and magnetograms (lower panel, right), SOHO/EIT images (upper panel, middle), GOES and RHESSI flare data (red and blue symbols) observed within the interval around the time of SDD data. |
|
When you want to zoom in on one of the images, simply move the mouse pointer over that image. |
 |
| Year | Month | Day | Hour | Min | Sec | NOAA | Proj.U | Proj.WS | Corr.U | Corr.WS | B | L | LCM | Pos.angle | r | MU | MP |
|---|---|---|---|---|---|---|---|---|---|---|---|---|---|---|---|---|---|
| 2002 | 10 | 11 | 03 | 11 | 33 | 10139 | 264 | 1559 | 160 | 941 | 9.58 | 336.35 | 35.12 | 277.99 | 0.5755 | 559.8 | 154.8 |
| Flare | Date | Start | Peak | End | Dur [s] | Peak [c/s] | Total Counts | Energy [keV] | X pos [asec] | Y pos [asec] | Radial [asec] | B [deg] | L [deg] | Flags |
|---|---|---|---|---|---|---|---|---|---|---|---|---|---|---|
| 21011126 | 11-Oct-2002 | 02:26:32 | 02:28:26 | 02:30:40 | 248 | 34 | 34944 | 6-12 | 557 | 50 | 559 | 8.04 | 336.46 | A0 |
| 21011127 | 11-Oct-2002 | 02:37:08 | 02:38:02 | 02:41:24 | 256 | 20 | 22536 | 6-12 | 558 | 44 | 560 | 7.68 | 336.41 | A0 |
| 21011128 | 11-Oct-2002 | 02:41:24 | 02:41:50 | 02:45:36 | 252 | 16 | 20664 | 6-12 | 564 | 51 | 566 | 8.07 | 336.86 | A0 |
| 2101188 | 11-Oct-2002 | 02:45:36 | 02:52:06 | 03:08:44 | 1388 | 100 | 305016 | 6-12 | 554 | 62 | 558 | 8.76 | 336.09 | A0 |
| 21011129 | 11-Oct-2002 | 03:08:44 | 03:09:30 | 03:10:40 | 116 | 22 | 13008 | 6-12 | 556 | 55 | 559 | 8.34 | 336.04 | A0 |
| 2101189 | 11-Oct-2002 | 03:10:40 | 03:13:38 | 03:16:08 | 328 | 80 | 55584 | 6-12 | 566 | 57 | 569 | 8.41 | 336.75 | A0 |
| 2101190 | 11-Oct-2002 | 03:57:40 | 04:03:10 | 04:13:00 | 920 | 136 | 349872 | 6-12 | 566 | 57 | 568 | 8.41 | 336.30 | A0 |
| 21011130 | 11-Oct-2002 | 04:13:00 | 04:15:34 | 04:18:24 | 324 | 46 | 67344 | 6-12 | 583 | 69 | 587 | 9.04 | 337.55 | A0 |
| 2101191 | 11-Oct-2002 | 04:18:24 | 04:19:58 | 04:22:52 | 268 | 48 | 55968 | 6-12 | 548 | 93 | 555 | 10.63 | 335.07 | A0 |
| 2101151 | 11-Oct-2002 | 04:24:12 | 04:32:58 | 04:37:20 | 788 | 560 | 1279440 | 6-12 | 576 | 59 | 579 | 8.48 | 336.79 | A0 |
| 21011131 | 11-Oct-2002 | 04:37:20 | 04:40:22 | 04:50:36 | 796 | 624 | 1009776 | 6-12 | 577 | 58 | 580 | 8.41 | 336.79 | A0 P1 PE |
| 2101168 | 11-Oct-2002 | 04:54:48 | 04:57:22 | 04:57:44 | 176 | 80 | 38184 | 6-12 | 575 | 58 | 578 | 8.42 | 336.48 | A0 |
| 2101106 | 11-Oct-2002 | 05:33:24 | 05:35:22 | 05:41:56 | 512 | 624 | 726888 | 6-12 | 539 | 103 | 549 | 11.26 | 333.80 | A0 |
| 21011132 | 11-Oct-2002 | 05:41:56 | 05:43:14 | 05:51:16 | 560 | 76 | 112152 | 6-12 | 578 | 61 | 582 | 8.58 | 336.31 | A0 |
| 21011133 | 11-Oct-2002 | 05:56:52 | 05:57:18 | 05:58:28 | 96 | 24 | 10968 | 6-12 | 573 | 58 | 576 | 8.43 | 335.78 | A0 |
| 2101195 | 11-Oct-2002 | 06:25:16 | 06:26:30 | 06:28:04 | 168 | 56 | 26352 | 6-12 | 581 | 43 | 582 | 7.50 | 336.02 | A0 |
| 21011134 | 11-Oct-2002 | 06:28:04 | 06:28:42 | 06:33:00 | 296 | 40 | 40368 | 6-12 | 579 | 60 | 582 | 8.52 | 335.96 | A0 |
| Date | Start | Peak | End | Classification | B [deg] | LCM [deg] |
|---|---|---|---|---|---|---|
| 11-Oct-2002 | 04:26 | 04:40 | 04:46 | C1.1 | 09 | 38 |

