move the mouse pointer over that image.
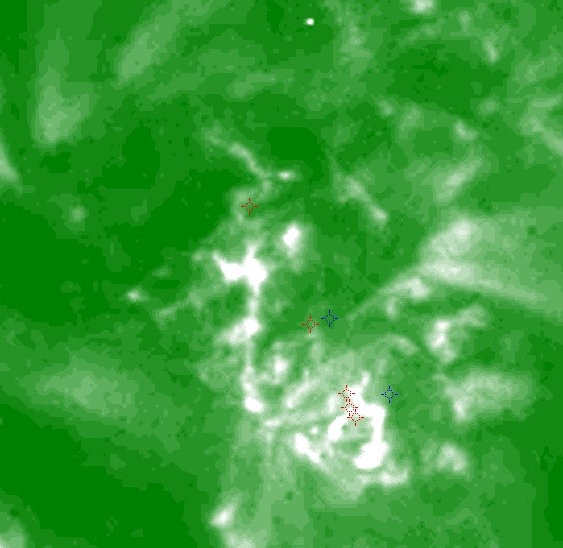
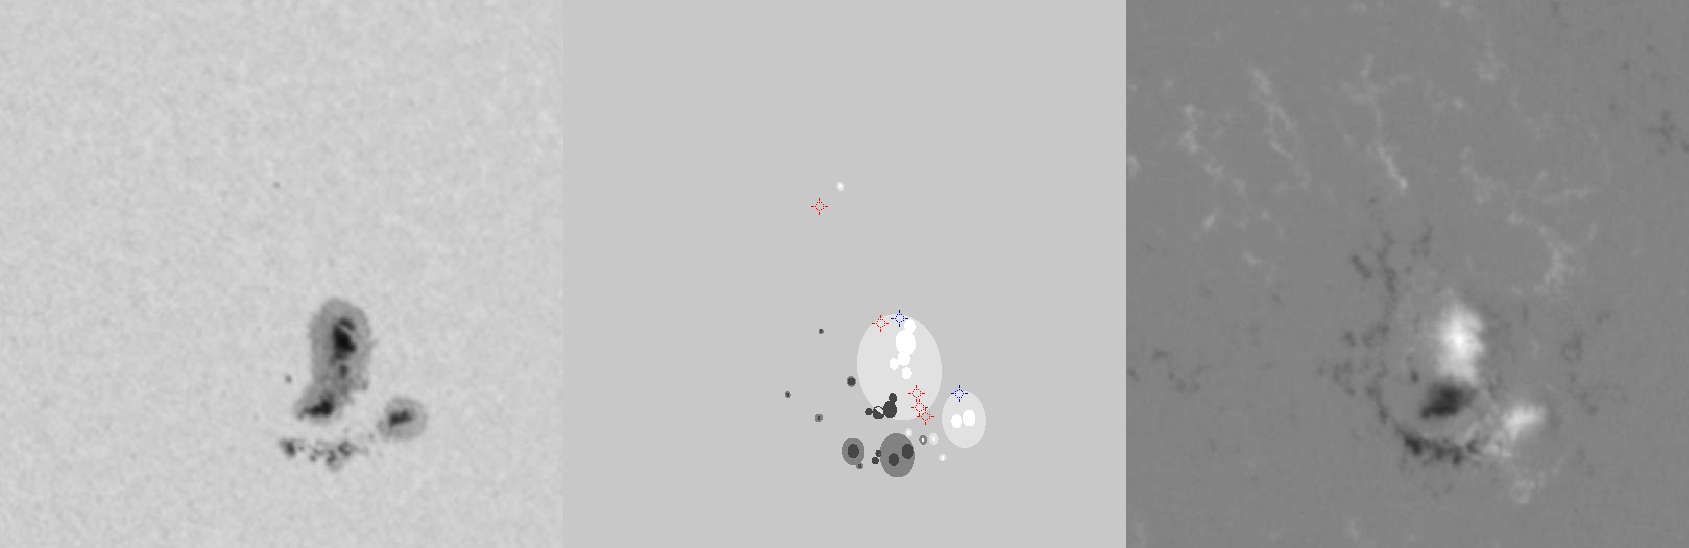
| Evolution of sunspot group NOAA 10139 and positions of flares in it animated by using the data of SOHO/MDI Debrecen Data (SDD) sunspot catalogue (lower panel, middle, ellipses with positions and areas corresponding to the relevant data of spots in SDD and with grey-scale colour coding of the magnetic polarities corresponding to that of the magnetograms), SOHO/MDI continuum images (lower panel, left) and magnetograms (lower panel, right), SOHO/EIT images (upper panel, middle), GOES and RHESSI flare data (red and blue symbols) observed within the interval around the time of SDD data. |
|
When you want to zoom in on one of the images, simply move the mouse pointer over that image. |
 |
| Year | Month | Day | Hour | Min | Sec | NOAA | Proj.U | Proj.WS | Corr.U | Corr.WS | B | L | LCM | Pos.angle | r | MU | MP |
|---|---|---|---|---|---|---|---|---|---|---|---|---|---|---|---|---|---|
| 2002 | 10 | 11 | 10 | 10 | 33 | 10139 | 228 | 1460 | 144 | 927 | 9.38 | 336.37 | 38.97 | 277.41 | 0.6282 | 372.2 | 194.1 |
| Flare | Date | Start | Peak | End | Dur [s] | Peak [c/s] | Total Counts | Energy [keV] | X pos [asec] | Y pos [asec] | Radial [asec] | B [deg] | L [deg] | Flags |
|---|---|---|---|---|---|---|---|---|---|---|---|---|---|---|
| 21011136 | 11-Oct-2002 | 07:30:04 | 07:33:14 | 07:35:24 | 320 | 26 | 28416 | 6-12 | 582 | 56 | 585 | 8.26 | 335.57 | A0 |
| 2101199 | 11-Oct-2002 | 07:36:20 | 07:37:06 | 07:38:28 | 128 | 38 | 13968 | 6-12 | 579 | 62 | 583 | 8.63 | 335.35 | A0 |
| 21011137 | 11-Oct-2002 | 07:58:56 | 07:59:30 | 07:59:52 | 56 | 28 | 7200 | 6-12 | 560 | 115 | 572 | 11.87 | 334.14 | A0 P1 PE |
| 21011139 | 11-Oct-2002 | 09:02:40 | 09:11:42 | 09:16:08 | 808 | 152 | 323376 | 6-12 | 539 | 190 | 572 | 16.45 | 332.73 | A0 |
| 21011104 | 11-Oct-2002 | 09:16:08 | 09:34:58 | 09:46:16 | 1808 | 816 | 2306352 | 12-25 | 605 | 73 | 609 | 9.15 | 336.34 | A0 P1 PE |
| Date | Start | Peak | End | Classification | B [deg] | LCM [deg] |
|---|---|---|---|---|---|---|
| 11-Oct-2002 | 08:29 | 08:35 | 08:44 | C2.4 | 12 | 38 |
| 11-Oct-2002 | 09:29 | 09:35 | 09:38 | C1.7 | 09 | 41 |

