move the mouse pointer over that image.
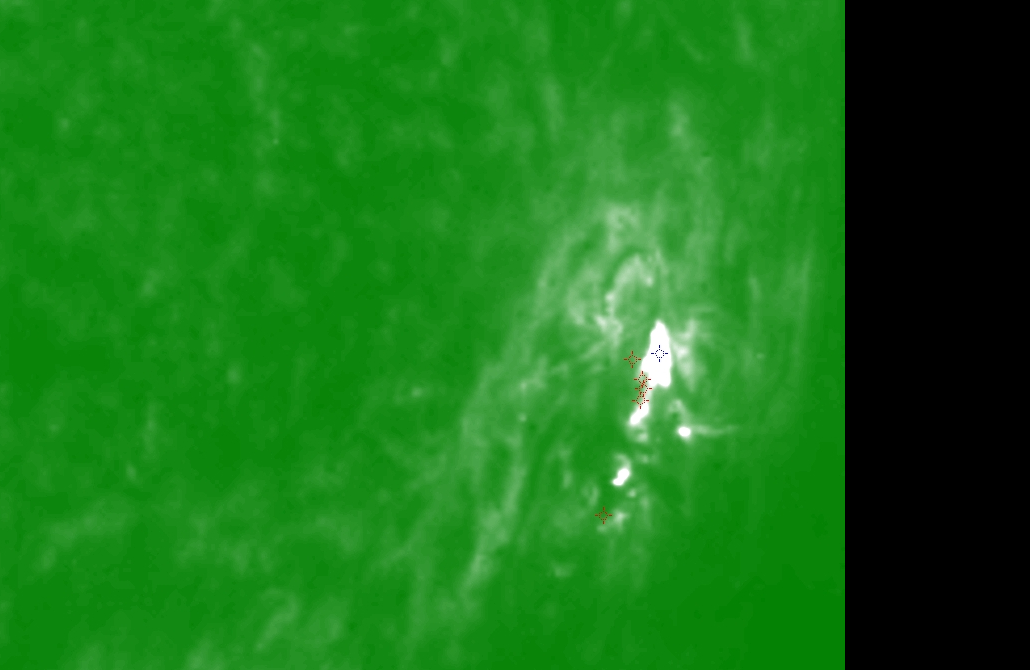
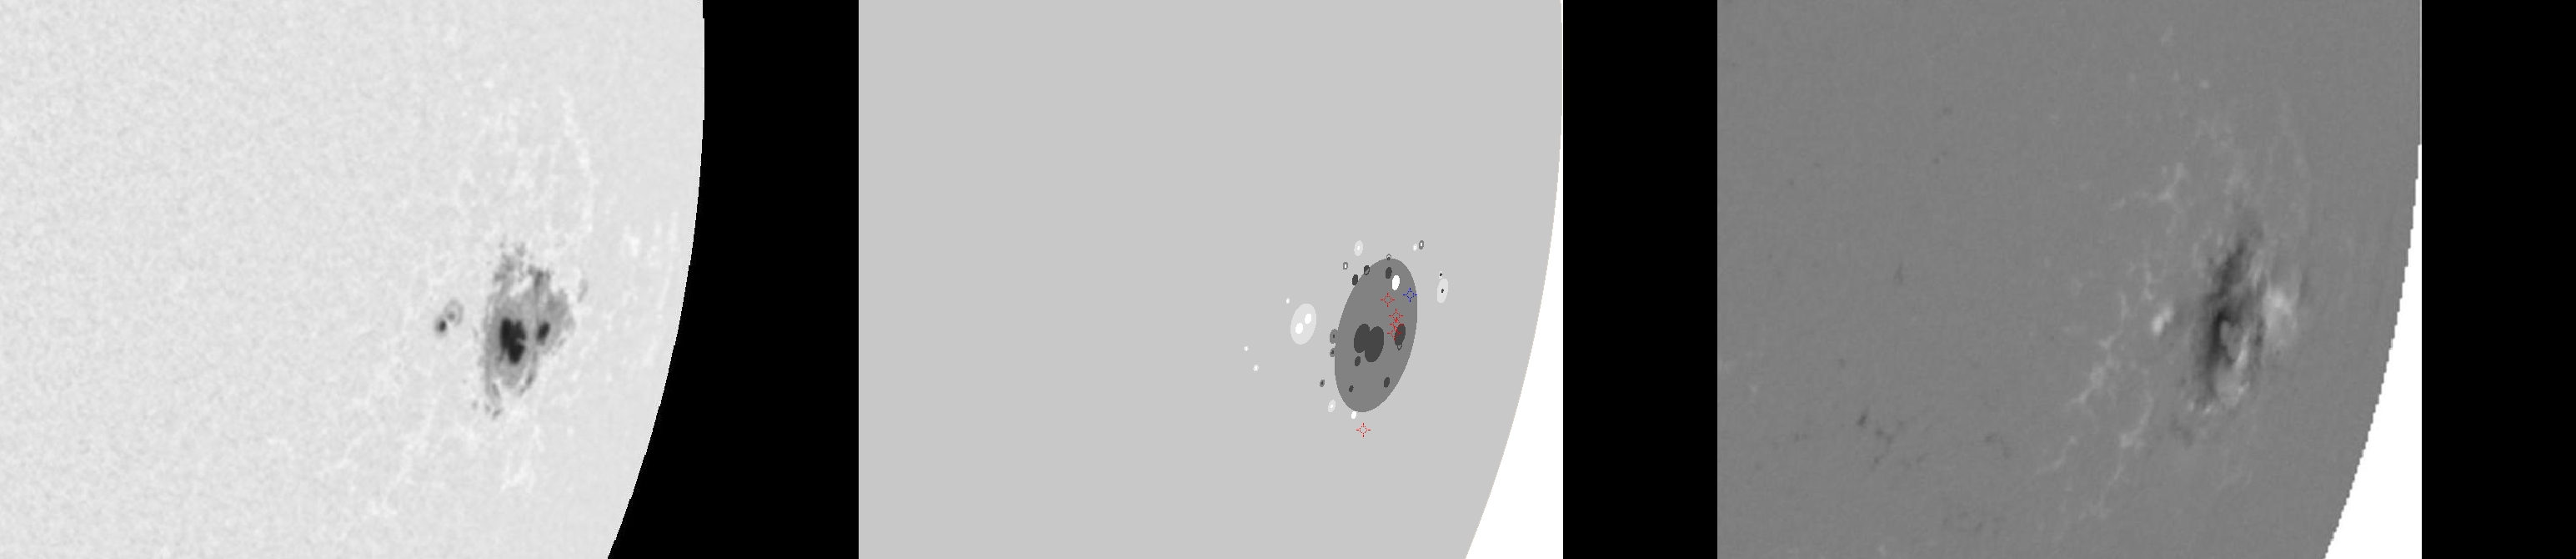
| Evolution of sunspot group NOAA 10069 and positions of flares in it animated by using the data of SOHO/MDI Debrecen Data (SDD) sunspot catalogue (lower panel, middle, ellipses with positions and areas corresponding to the relevant data of spots in SDD and with grey-scale colour coding of the magnetic polarities corresponding to that of the magnetograms), SOHO/MDI continuum images (lower panel, left) and magnetograms (lower panel, right), SOHO/EIT images (upper panel, middle), GOES and RHESSI flare data (red and blue symbols) observed within the interval around the time of SDD data. |
|
When you want to zoom in on one of the images, simply move the mouse pointer over that image. |
 |
| Year | Month | Day | Hour | Min | Sec | NOAA | Proj.U | Proj.WS | Corr.U | Corr.WS | B | L | LCM | Pos.angle | r | MU | MP |
|---|---|---|---|---|---|---|---|---|---|---|---|---|---|---|---|---|---|
| 2002 | 08 | 22 | 01 | 35 | 32 | 10069 | 272 | 2077 | 277 | 2122 | -8.25 | 301.27 | 59.25 | 256.54 | 0.8759 | -408.1 | -250.1 |
| Flare | Date | Start | Peak | End | Dur [s] | Peak [c/s] | Total Counts | Energy [keV] | X pos [asec] | Y pos [asec] | Radial [asec] | B [deg] | L [deg] | Flags |
|---|---|---|---|---|---|---|---|---|---|---|---|---|---|---|
| 2082142 | 21-Aug-2002 | 23:57:40 | 23:59:34 | 00:03:28 | 348 | 152 | 74328 | 25-50 | 815 | -176 | 834 | -7.01 | 300.89 | A1 |
| 20822105 | 22-Aug-2002 | 00:03:28 | 00:04:42 | 00:06:00 | 152 | 18 | 10824 | 12-25 | 821 | -201 | 846 | -8.66 | 301.94 | A1 |
| 2082202 | 22-Aug-2002 | 00:08:04 | 00:08:34 | 00:09:40 | 96 | 18 | 6936 | 12-25 | 823 | -194 | 845 | -8.24 | 302.04 | A1 |
| 2082204 | 22-Aug-2002 | 00:36:04 | 00:36:22 | 00:38:00 | 116 | 16 | 8856 | 6-12 | 827 | -187 | 848 | -7.85 | 302.18 | A1 |
| 20822106 | 22-Aug-2002 | 01:45:08 | 01:54:22 | 02:22:12 | 2224 | 3824 | 9830232 | 50-100 | 814 | -270 | 858 | -12.99 | 301.53 | A1 |
| Date | Start | Peak | End | Classification | B [deg] | LCM [deg] |
|---|---|---|---|---|---|---|
| 22-Aug-2002 | 01:47 | 01:57 | 02:05 | M5.4 | -07 | 62 |

