move the mouse pointer over that image.
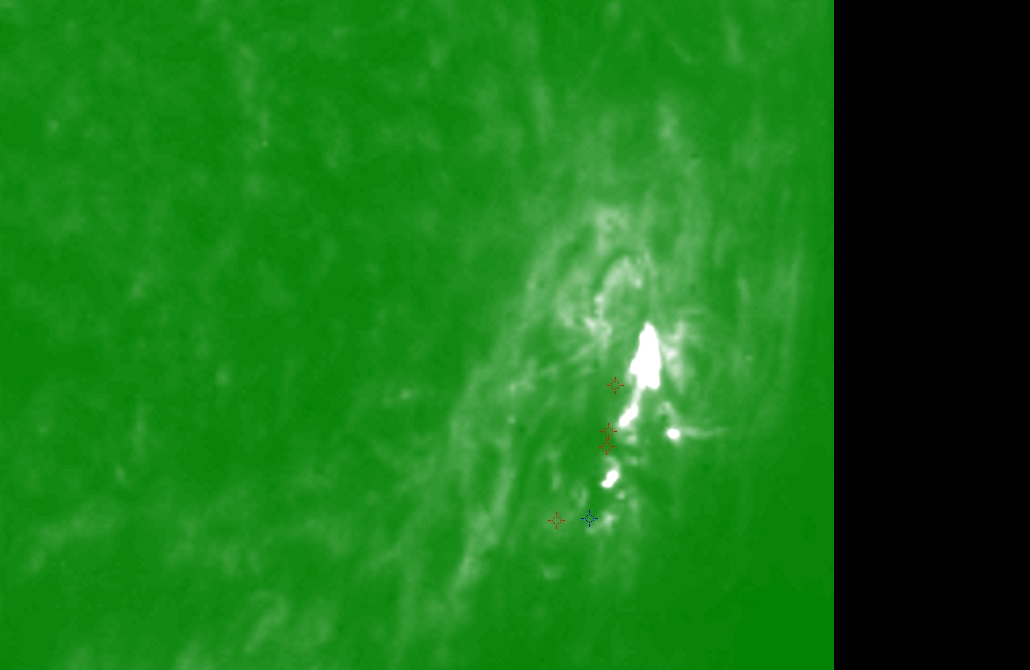
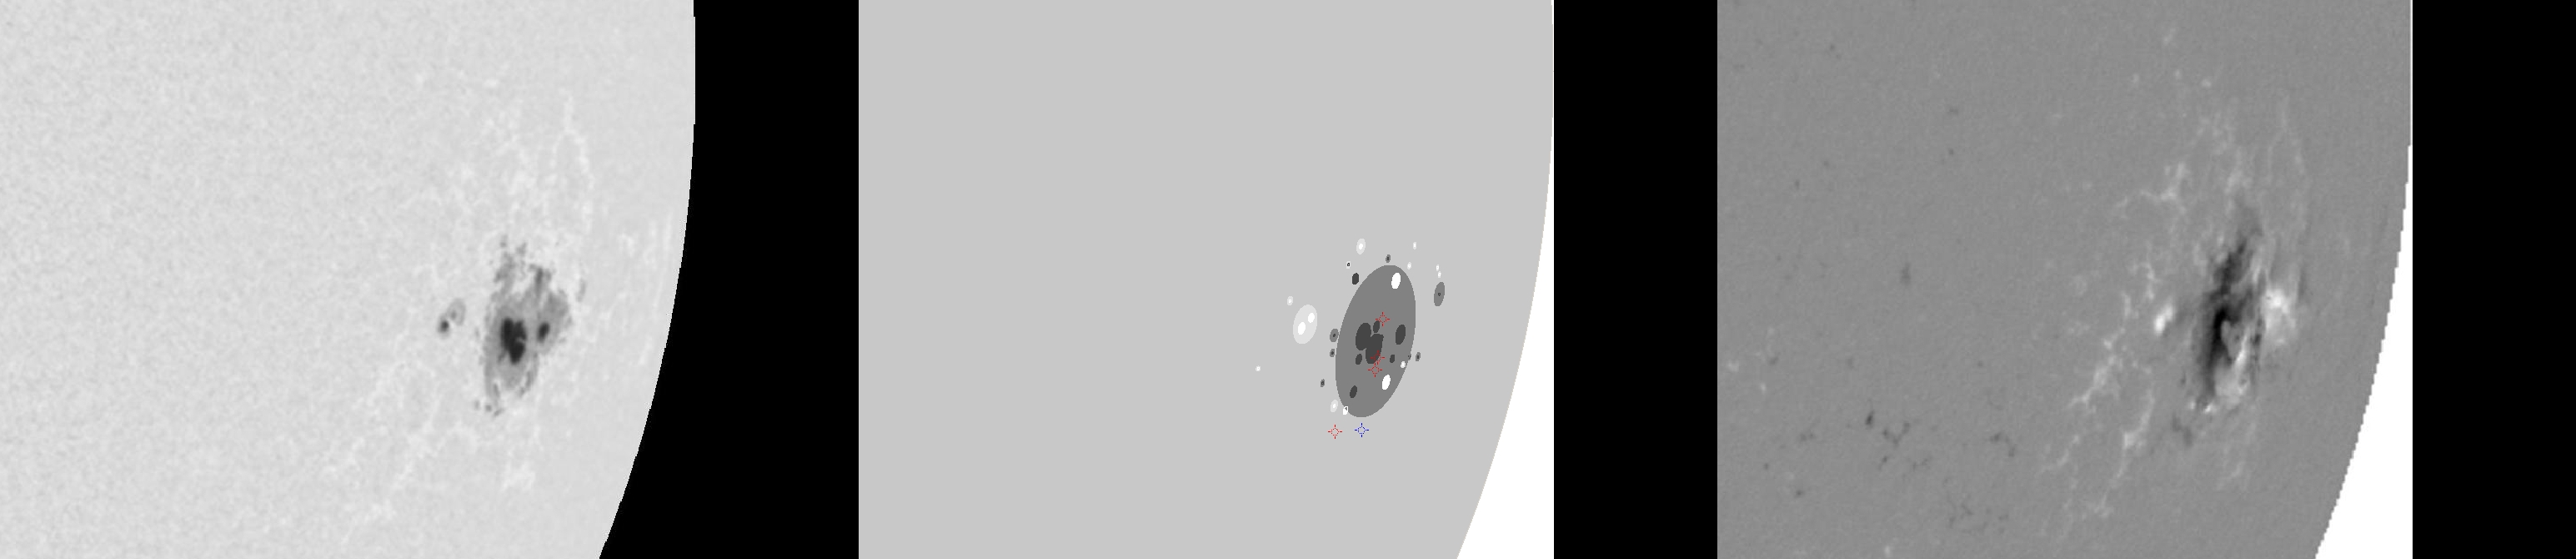
| Evolution of sunspot group NOAA 10069 and positions of flares in it animated by using the data of SOHO/MDI Debrecen Data (SDD) sunspot catalogue (lower panel, middle, ellipses with positions and areas corresponding to the relevant data of spots in SDD and with grey-scale colour coding of the magnetic polarities corresponding to that of the magnetograms), SOHO/MDI continuum images (lower panel, left) and magnetograms (lower panel, right), SOHO/EIT images (upper panel, middle), GOES and RHESSI flare data (red and blue symbols) observed within the interval around the time of SDD data. |
|
When you want to zoom in on one of the images, simply move the mouse pointer over that image. |
 |
| Year | Month | Day | Hour | Min | Sec | NOAA | Proj.U | Proj.WS | Corr.U | Corr.WS | B | L | LCM | Pos.angle | r | MU | MP |
|---|---|---|---|---|---|---|---|---|---|---|---|---|---|---|---|---|---|
| 2002 | 08 | 22 | 03 | 11 | 32 | 10069 | 257 | 1982 | 270 | 2088 | -8.52 | 301.31 | 60.17 | 256.46 | 0.8837 | -356.1 | -240.4 |
| Flare | Date | Start | Peak | End | Dur [s] | Peak [c/s] | Total Counts | Energy [keV] | X pos [asec] | Y pos [asec] | Radial [asec] | B [deg] | L [deg] | Flags |
|---|---|---|---|---|---|---|---|---|---|---|---|---|---|---|
| 2082207 | 22-Aug-2002 | 03:06:44 | 03:09:18 | 03:12:24 | 340 | 44 | 37829 | 12-25 | 797 | -271 | 842 | -12.82 | 298.73 | A1 DF P1 |
| 20822107 | 22-Aug-2002 | 03:12:24 | 03:14:06 | 03:15:40 | 196 | 21 | 15963 | 6-12 | 833 | -186 | 854 | -7.87 | 301.47 | A1 DF P1 |
| 2082239 | 22-Aug-2002 | 03:20:20 | 03:21:46 | 03:23:08 | 168 | 32 | 17061 | 12-25 | 830 | -215 | 857 | -9.66 | 301.53 | A1 DF P1 |
| 2082210 | 22-Aug-2002 | 05:06:12 | 05:07:18 | 05:10:40 | 268 | 32 | 27096 | 12-25 | 843 | -221 | 871 | -10.24 | 302.46 | A1 DF P1 PE |
| Date | Start | Peak | End | Classification | B [deg] | LCM [deg] |
|---|---|---|---|---|---|---|
| 22-Aug-2002 | 03:06 | 03:09 | 03:13 | C3.1 | -13 | 60 |

