move the mouse pointer over that image.
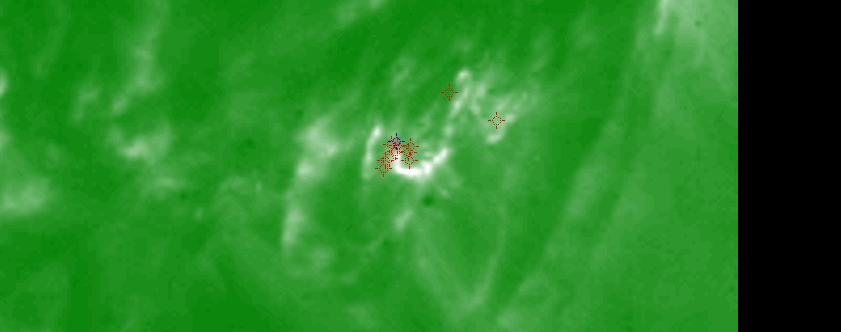
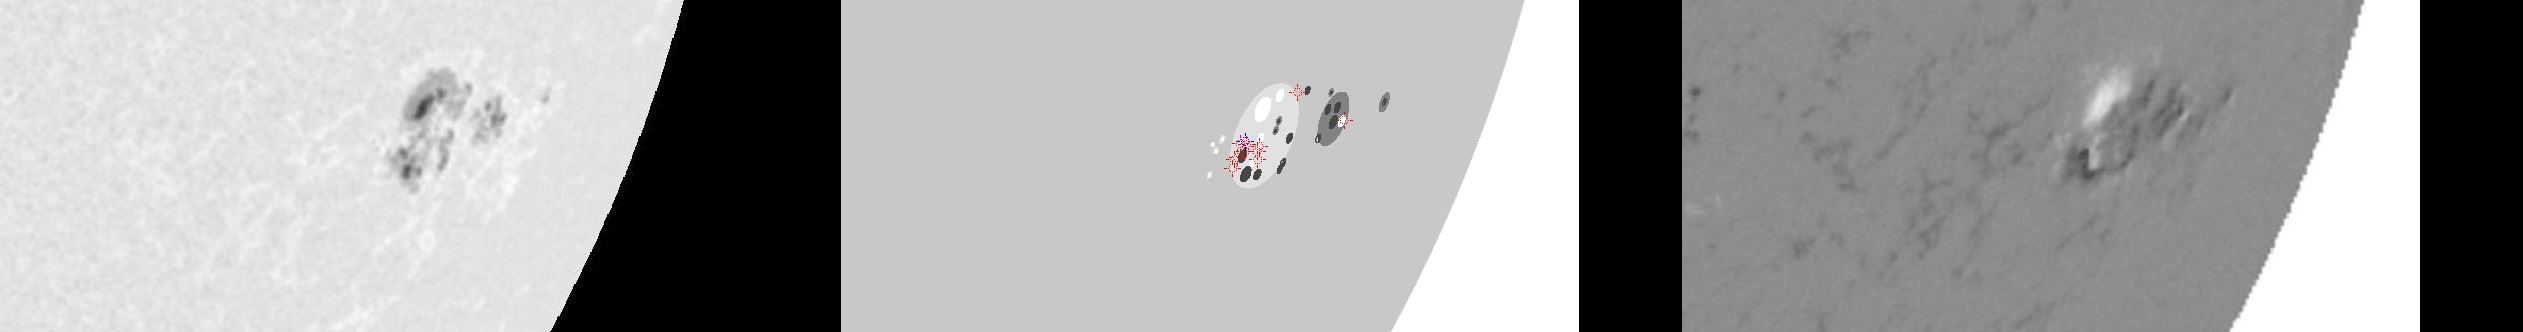
| Evolution of sunspot group NOAA 10017 and positions of flares in it animated by using the data of SOHO/MDI Debrecen Data (SDD) sunspot catalogue (lower panel, middle, ellipses with positions and areas corresponding to the relevant data of spots in SDD and with grey-scale colour coding of the magnetic polarities corresponding to that of the magnetograms), SOHO/MDI continuum images (lower panel, left) and magnetograms (lower panel, right), SOHO/EIT images (upper panel, middle), GOES and RHESSI flare data (red and blue symbols) observed within the interval around the time of SDD data. |
|
When you want to zoom in on one of the images, simply move the mouse pointer over that image. |
 |
| Year | Month | Day | Hour | Min | Sec | NOAA | Proj.U | Proj.WS | Corr.U | Corr.WS | B | L | LCM | Pos.angle | r | MU | MP |
|---|---|---|---|---|---|---|---|---|---|---|---|---|---|---|---|---|---|
| 2002 | 07 | 03 | 16 | 49 | 32 | 10017 | 137 | 843 | 142 | 870 | -18.58 | 233.55 | 58.24 | 246.73 | 0.8784 | 54.2 | -8.1 |
| Flare | Date | Start | Peak | End | Dur [s] | Peak [c/s] | Total Counts | Energy [keV] | X pos [asec] | Y pos [asec] | Radial [asec] | B [deg] | L [deg] | Flags |
|---|---|---|---|---|---|---|---|---|---|---|---|---|---|---|
| 20703102 | 3-Jul-2002 | 12:57:16 | 12:58:18 | 13:01:16 | 240 | 12 | 12456 | 6-12 | 789 | -329 | 855 | -18.53 | 236.41 | A0 DF GE P1 PE |
| 20703103 | 3-Jul-2002 | 13:32:08 | 13:32:14 | 13:42:28 | 620 | 144 | 116472 | 6-12 | 736 | -348 | 814 | -19.48 | 230.41 | A0 DF GS P1 |
| 20703132 | 3-Jul-2002 | 13:42:28 | 13:45:42 | 13:51:12 | 524 | 304 | 234074 | 12-25 | 739 | -353 | 819 | -19.82 | 230.78 | A0 DF P1 |
| 20703105 | 3-Jul-2002 | 14:17:08 | 14:20:58 | 14:22:52 | 344 | 8 | 11568 | 6-12 | 736 | -347 | 814 | -19.41 | 229.93 | A0 DF P1 |
| 20703133 | 3-Jul-2002 | 14:22:52 | 14:24:54 | 14:30:44 | 472 | 12 | 22704 | 6-12 | 746 | -344 | 821 | -19.26 | 230.92 | A0 DF P1 |
| 20703134 | 3-Jul-2002 | 14:30:44 | 14:32:34 | 14:35:08 | 264 | 13 | 13008 | 6-12 | 739 | -343 | 815 | -19.16 | 230.02 | A0 DF P1 |
| 2070324 | 3-Jul-2002 | 15:49:40 | 15:53:42 | 16:04:08 | 868 | 336 | 511848 | 12-25 | 747 | -350 | 825 | -19.66 | 230.42 | A0 DF P1 |
| 20703135 | 3-Jul-2002 | 16:04:08 | 16:05:30 | 16:15:00 | 652 | 56 | 78360 | 12-25 | 786 | -309 | 844 | -17.20 | 233.58 | A0 DF P1 |
| 2070325 | 3-Jul-2002 | 16:15:00 | 16:15:18 | 16:20:04 | 304 | 15 | 21048 | 6-12 | 752 | -341 | 826 | -19.09 | 230.49 | A0 DF P1 |
| 20703107 | 3-Jul-2002 | 16:20:04 | 16:26:26 | 16:26:36 | 392 | 128 | 62040 | 6-12 | 750 | -351 | 828 | -19.74 | 230.50 | A0 DF GE P1 PE |
| 2070336 | 3-Jul-2002 | 16:51:12 | 16:52:38 | 16:57:12 | 360 | 120 | 130464 | 12-25 | 753 | -356 | 833 | -20.08 | 230.79 | A0 DF GS P1 |
| Date | Start | Peak | End | Classification | B [deg] | LCM [deg] |
|---|---|---|---|---|---|---|
| 3-Jul-2002 | 13:23 | 13:30 | 13:32 | C1.2 | -19 | 54 |

