move the mouse pointer over that image.
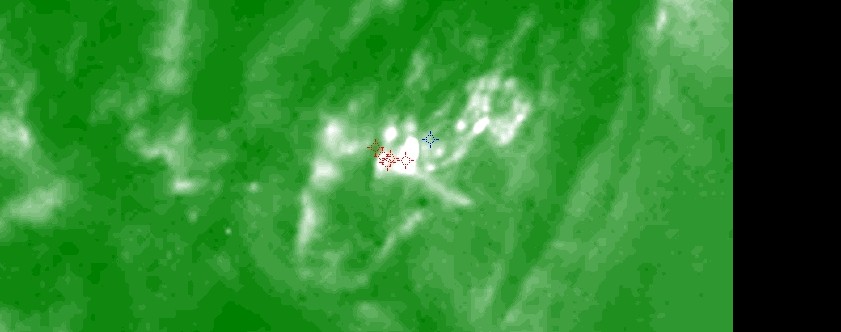
| Evolution of sunspot group NOAA 10017 and positions of flares in it animated by using the data of SOHO/MDI Debrecen Data (SDD) sunspot catalogue (lower panel, middle, ellipses with positions and areas corresponding to the relevant data of spots in SDD and with grey-scale colour coding of the magnetic polarities corresponding to that of the magnetograms), SOHO/MDI continuum images (lower panel, left) and magnetograms (lower panel, right), SOHO/EIT images (upper panel, middle), GOES and RHESSI flare data (red and blue symbols) observed within the interval around the time of SDD data. |
|
When you want to zoom in on one of the images, simply move the mouse pointer over that image. |
 |
| Year | Month | Day | Hour | Min | Sec | NOAA | Proj.U | Proj.WS | Corr.U | Corr.WS | B | L | LCM | Pos.angle | r | MU | MP |
|---|---|---|---|---|---|---|---|---|---|---|---|---|---|---|---|---|---|
| 2002 | 07 | 03 | 17 | 35 | 32 | 10017 | 117 | 841 | 121 | 883 | -18.61 | 233.74 | 58.85 | 246.87 | 0.8830 | 46.8 | -7.7 |
| Flare | Date | Start | Peak | End | Dur [s] | Peak [c/s] | Total Counts | Energy [keV] | X pos [asec] | Y pos [asec] | Radial [asec] | B [deg] | L [deg] | Flags |
|---|---|---|---|---|---|---|---|---|---|---|---|---|---|---|
| 2070376 | 3-Jul-2002 | 17:26:08 | 17:26:54 | 17:29:00 | 172 | 1 | 771 | 6-12 | 760 | -351 | 837 | -19.79 | 231.13 | A0 DF P1 |
| 20703137 | 3-Jul-2002 | 17:29:00 | 17:39:46 | 17:44:16 | 916 | 2 | 4702 | 6-12 | 748 | -348 | 825 | -19.53 | 229.49 | A0 DF P1 |
| 20703108 | 3-Jul-2002 | 17:44:16 | 17:46:54 | 17:52:20 | 484 | 9 | 10613 | 12-25 | 752 | -352 | 830 | -19.81 | 230.03 | A0 DF P1 |
| 2070377 | 3-Jul-2002 | 17:52:20 | 17:54:02 | 18:02:00 | 580 | 5 | 8475 | 6-12 | 755 | -349 | 832 | -19.63 | 230.21 | A0 DF P1 |
| 20703109 | 3-Jul-2002 | 18:02:00 | 18:07:38 | 18:08:36 | 396 | 94 | 62523 | 12-25 | 748 | -342 | 823 | -19.13 | 229.03 | a0 A1 DF GE P1 PE |
| Date | Start | Peak | End | Classification | B [deg] | LCM [deg] |
|---|---|---|---|---|---|---|
| 3-Jul-2002 | 18:03 | 18:08 | 18:11 | C3.0 | -19 | 58 |

