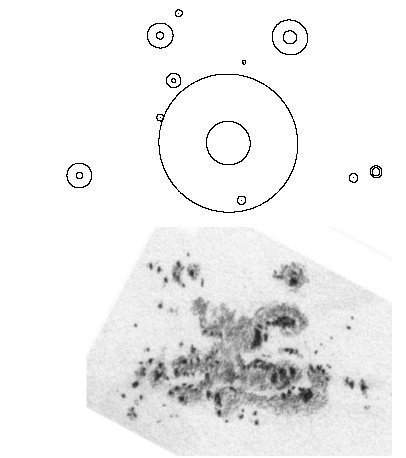
The figure below (by László Tóth and György Mezõ) demonstrates the difference between the information content of an original observation and the numerical data . The figure shows the complex active region observed in Oct. 20, 1905. The upper drawing was plotted on the basis of the GPHR (Greenwich Photoheliographic Results), the areas and positions of the circles correspond to the areas and positions indicated in these tables. The lower drawing is a part of the full-disc observation taken at the Kalocsa Observatory. Only some features can be identified. If any morphological properties are considered, the original observations provide much more detailed information than the reduced numerical tables.