SOHO MDI 2000-11-28 15:59:32 UT
| group | Proj. U | Proj. WS | Corr. U | Corr. WS | B | L | LCM | Pos. angle | r | MU | MP |
| 132 | 1077 | 68 | 540 | 9.38 | 296.74 | 0.09 | 359.36 | 0.1443 | 1108.7 | 155.8 | |
|
previous
or next observation for the same group /
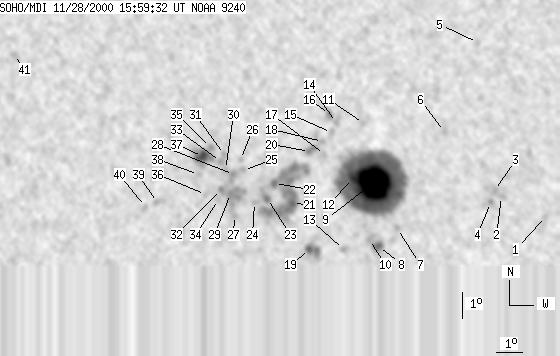
back to the solar disc SOHO MDI 2000-11-28 15:59:32 UT |
| spot | Proj. U | Proj. WS | Corr. U | Corr. WS | B | L | LCM | Pos. angle | r | MU | MP |
| 0 | 3 | 0 | 2 | 8.10 | 305.25 | 8.60 | 309.60 | 0.1931 | 621.0 | 632.9 | |
| 0 | 7 | 0 | 3 | 8.87 | 303.55 | 6.90 | 318.86 | 0.1812 | 842.0 | 764.1 | |
| 0 | 6 | 0 | 3 | 9.11 | 303.28 | 6.63 | 320.82 | 0.1813 | 739.0 | 729.8 | |
| 0 | 4 | 0 | 2 | 8.64 | 303.11 | 6.46 | 319.82 | 0.1734 | 870.0 | 864.4 | |
| 0 | 5 | 0 | 3 | 14.88 | 302.74 | 6.10 | 336.74 | 0.2611 | 372.0 | 483.7 | |
| 0 | 6 | 0 | 3 | 11.40 | 301.36 | 4.71 | 335.80 | 0.1975 | 579.0 | 662.4 | |
| 0 | 5 | 0 | 3 | 7.65 | 299.49 | 2.84 | 336.75 | 0.1252 | -384.0 | -289.1 | |
| 3 | 17 | 2 | 9 | 6.95 | 298.75 | 2.11 | 340.40 | 0.1092 | -875.9 | -648.9 | |
| 102 | 531 | 51 | 266 | 9.42 | 298.57 | 1.92 | 347.15 | 0.1496 | 1779.9 | 730.4 | |
| 0 | 13 | 0 | 6 | 7.22 | 298.41 | 1.76 | 344.13 | 0.1119 | -89.0 | -152.2 | |
| 0 | 2 | 0 | 1 | 11.71 | 298.20 | 1.55 | 351.85 | 0.1874 | -89.0 | -69.0 | |
| 7 | -9 | 4 | -9 | 9.58 | 297.76 | 1.11 | 352.64 | 0.1498 | 1282.4 | 999999 | |
| 0 | 5 | 0 | 2 | 6.84 | 297.40 | 0.75 | 352.58 | 0.1018 | 478.0 | 374.2 | |
| 0 | 8 | 0 | 4 | 11.75 | 297.14 | 0.49 | 357.40 | 0.1864 | 617.0 | 469.8 | |
| 0 | 5 | 0 | 3 | 11.36 | 296.94 | 0.30 | 358.38 | 0.1795 | 561.0 | 427.8 | |
| 0 | 11 | 0 | 5 | 12.07 | 296.87 | 0.22 | 358.88 | 0.1916 | 785.0 | 533.0 | |
| 0 | 5 | 0 | 2 | 10.51 | 296.67 | 0.02 | 359.86 | 0.1647 | 580.0 | 498.4 | |
| 0 | 16 | 0 | 8 | 11.01 | 296.59 | -0.06 | 0.31 | 0.1734 | 660.0 | 543.8 | |
| 3 | 21 | 2 | 10 | 6.84 | 296.09 | -0.56 | 5.48 | 0.1014 | -856.3 | -847.5 | |
| 0 | 10 | 0 | 5 | 10.63 | 296.09 | -0.56 | 3.32 | 0.1670 | 23.0 | 299.1 | |
| 4 | 202 | 2 | 101 | 8.61 | 295.43 | -1.22 | 9.09 | 0.1335 | -213.4 | -332.3 | |
| 2 | -21 | 1 | -21 | 9.38 | 294.73 | -1.92 | 12.87 | 0.1490 | -583.2 | 999999 | |
| 0 | 14 | 0 | 7 | 8.80 | 294.46 | -2.19 | 15.66 | 0.1403 | -1232.0 | -1006.3 | |
| 0 | 6 | 0 | 3 | 8.65 | 293.96 | -2.69 | 19.39 | 0.1404 | -571.0 | -700.1 | |
| 0 | 5 | 0 | 2 | 9.89 | 293.52 | -3.13 | 19.33 | 0.1631 | -922.0 | -753.6 | |
| 0 | 4 | 0 | 2 | 10.31 | 293.40 | -3.25 | 19.15 | 0.1708 | -178.0 | -283.4 | |
| 0 | 10 | 0 | 5 | 8.15 | 293.19 | -3.46 | 25.88 | 0.1375 | -895.0 | -828.9 | |
| 0 | 9 | 0 | 5 | 9.73 | 293.13 | -3.51 | 21.87 | 0.1630 | -992.0 | -971.4 | |
| 0 | 36 | 0 | 18 | 9.00 | 293.03 | -3.62 | 24.36 | 0.1520 | -992.0 | -1075.1 | |
| 0 | 7 | 0 | 4 | 9.92 | 292.82 | -3.83 | 23.14 | 0.1681 | -926.0 | -809.8 | |
| 0 | 8 | 0 | 4 | 10.51 | 292.77 | -3.87 | 22.06 | 0.1777 | -453.0 | -586.2 | |
| 0 | 12 | 0 | 6 | 9.15 | 292.67 | -3.97 | 25.97 | 0.1570 | -725.0 | -829.2 | |
| 0 | 8 | 0 | 4 | 10.23 | 292.62 | -4.03 | 23.46 | 0.1744 | -1174.0 | -974.0 | |
| 0 | 4 | 0 | 2 | 8.76 | 292.56 | -4.09 | 27.76 | 0.1520 | -665.0 | -695.1 | |
| 0 | 7 | 0 | 3 | 10.78 | 292.22 | -4.42 | 24.21 | 0.1857 | -472.0 | -699.3 | |
| 0 | 3 | 0 | 2 | 8.96 | 292.05 | -4.59 | 29.98 | 0.1591 | -594.0 | -454.4 | |
| 11 | 38 | 6 | 19 | 10.43 | 291.92 | -4.73 | 26.52 | 0.1825 | -1223.3 | -1025.2 | |
| 0 | 5 | 0 | 3 | 9.73 | 291.77 | -4.88 | 29.10 | 0.1731 | -538.0 | -623.9 | |
| 0 | 5 | 0 | 3 | 8.64 | 290.19 | -6.46 | 40.15 | 0.1733 | -599.0 | -542.7 | |
| 0 | 5 | 0 | 2 | 8.49 | 289.73 | -6.92 | 42.71 | 0.1766 | -603.0 | -536.0 | |
| 0 | 9 | 0 | 5 | 14.39 | 284.32 | -12.33 | 41.86 | 0.3113 | -427.0 | -454.0 | |
| Proj. U | - Projected umbra area in millionths of solar disc, negative values indicate | |
|
that the umbra consists of fragmented regions which cannot be separated without losing umbral area. In this way several spots (intensity minima in the umbra) have a common umbra, e.g. -2 means that the given spot shares an umbra with spot No.2, and the common U value is indicated at spot No.2. |
||
| Proj. WS | - Projected whole spot area in millionths of solar disc, negative values indicate | |
|
that several umbras have a common penumbra, e.g. -7 means that the given umbra shares a penumbra with umbra No.7, and the WS value is indicated at No.7. |
||
| Corr. U | - Corrected umbra area in millionths of solar hemisphere, for negative values see above | |
| Corr. WS | - Corrected whole spot area in millionths of solar hemisphere, for negative values see above | |
| B | - Heliographic latitude B; positive: North, negative: South | |
| L | - Heliographic longitude L | |
| LCM | - Longitudinal distance from the Sun's central meridian | |
| Pos. angle | - Position angle | |
| r | - Distance from the centre of Sun's disc in terms of Sun's radius | |
| MU | - Mean magnetic field within the umbra contour averaged the pixel values with sign. | |
| MP | - Mean magnetic field within the penumbra contour averaged the pixel values with sign. | |