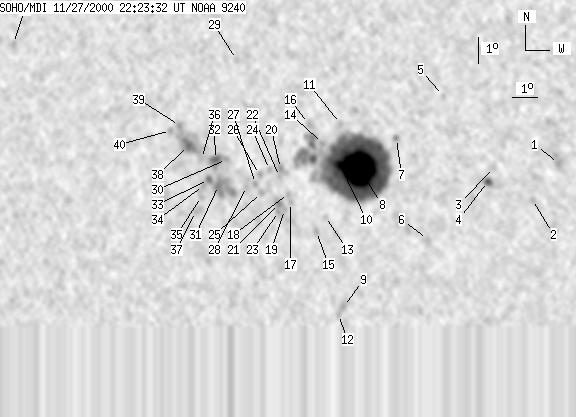
SOHO MDI 2000-11-27 22:23:32 UT
| group | Proj. U | Proj. WS | Corr. U | Corr. WS | B | L | LCM | Pos. angle | r | MU | MP |
| 112 | 1048 | 58 | 533 | 9.48 | 297.20 | -9.11 | 45.61 | 0.2171 | 1439.9 | 225.6 | |
|
previous
or next observation for the same group /
back to the solar disc SOHO MDI 2000-11-27 22:23:32 UT |
| spot | Proj. U | Proj. WS | Corr. U | Corr. WS | B | L | LCM | Pos. angle | r | MU | MP |
| 0 | 24 | 0 | 12 | 9.75 | 306.18 | -0.13 | 0.85 | 0.1500 | 842.0 | 607.8 | |
| 0 | 5 | 0 | 3 | 8.36 | 305.18 | -1.13 | 8.89 | 0.1273 | 609.0 | 631.6 | |
| 0 | 4 | 0 | 2 | 9.60 | 303.66 | -2.65 | 17.30 | 0.1543 | 276.0 | 437.7 | |
| 3 | 10 | 2 | 5 | 9.05 | 303.43 | -2.88 | 19.89 | 0.1467 | 1033.8 | 877.6 | |
| 0 | 3 | 0 | 2 | 12.39 | 301.67 | -4.64 | 22.10 | 0.2112 | 350.0 | 503.4 | |
| 0 | 10 | 0 | 5 | 6.82 | 301.12 | -5.19 | 42.34 | 0.1339 | 332.0 | 276.3 | |
| 0 | 4 | 0 | 2 | 10.72 | 299.85 | -6.46 | 33.65 | 0.2003 | -182.0 | -122.0 | |
| 102 | 686 | 52 | 347 | 9.51 | 298.43 | -7.88 | 42.94 | 0.1994 | 1729.3 | 625.7 | |
| 0 | 5 | 0 | 3 | 4.23 | 297.90 | -8.41 | 69.79 | 0.1562 | -665.0 | -559.0 | |
| 7 | -8 | 4 | -8 | 9.66 | 297.68 | -8.63 | 44.99 | 0.2102 | 1498.5 | 999999 | |
| 0 | 4 | 0 | 2 | 11.29 | 297.63 | -8.67 | 40.04 | 0.2310 | 349.0 | 243.0 | |
| 0 | 6 | 0 | 3 | 3.93 | 297.71 | -8.60 | 72.04 | 0.1576 | -810.0 | -665.4 | |
| 0 | 5 | 0 | 2 | 7.69 | 297.14 | -9.17 | 54.21 | 0.1956 | -369.0 | -301.7 | |
| 0 | 4 | 0 | 2 | 10.51 | 296.95 | -9.36 | 44.52 | 0.2292 | 130.0 | 267.2 | |
| 0 | 5 | 0 | 2 | 7.11 | 296.80 | -9.51 | 57.65 | 0.1950 | -762.0 | -647.5 | |
| 0 | 8 | 0 | 4 | 11.29 | 296.37 | -9.94 | 43.88 | 0.2454 | 591.0 | 507.5 | |
| 0 | 4 | 0 | 2 | 8.23 | 295.75 | -10.56 | 55.80 | 0.2203 | -570.0 | -517.5 | |
| 0 | 4 | 0 | 2 | 8.57 | 295.66 | -10.64 | 54.72 | 0.2248 | -481.0 | -619.3 | |
| 0 | 3 | 0 | 1 | 7.96 | 295.52 | -10.79 | 57.39 | 0.2210 | -569.0 | -601.2 | |
| 0 | 5 | 0 | 3 | 9.54 | 295.32 | -10.99 | 52.18 | 0.2391 | -410.0 | -283.8 | |
| 0 | 8 | 0 | 4 | 8.19 | 295.32 | -10.99 | 56.99 | 0.2260 | -1171.0 | -989.7 | |
| 0 | 4 | 0 | 2 | 9.23 | 295.29 | -11.02 | 53.31 | 0.2364 | -280.0 | -298.8 | |
| 0 | 4 | 0 | 2 | 7.88 | 295.29 | -11.02 | 58.24 | 0.2237 | -756.0 | -715.7 | |
| 0 | 4 | 0 | 2 | 9.50 | 294.89 | -11.42 | 53.36 | 0.2446 | -625.0 | -525.2 | |
| 0 | 6 | 0 | 3 | 8.61 | 294.60 | -11.71 | 57.09 | 0.2402 | -690.0 | -470.9 | |
| 0 | 5 | 0 | 3 | 9.30 | 294.50 | -11.81 | 54.91 | 0.2481 | -885.0 | -610.5 | |
| 0 | 4 | 0 | 2 | 8.95 | 294.35 | -11.96 | 56.42 | 0.2469 | -750.0 | -602.6 | |
| 0 | 14 | 0 | 7 | 8.84 | 294.00 | -12.31 | 57.56 | 0.2508 | -974.0 | -813.0 | |
| 0 | 6 | 0 | 3 | 13.78 | 293.37 | -12.94 | 44.82 | 0.3099 | 510.0 | 590.1 | |
| 0 | 5 | 0 | 3 | 9.88 | 293.16 | -13.15 | 55.86 | 0.2720 | -917.0 | -714.5 | |
| 0 | 46 | 0 | 24 | 8.87 | 292.88 | -13.43 | 59.60 | 0.2672 | -1456.0 | -1091.5 | |
| 0 | 21 | 0 | 11 | 9.88 | 292.72 | -13.59 | 56.71 | 0.2782 | -1242.0 | -997.4 | |
| 0 | 11 | 0 | 6 | 9.10 | 292.47 | -13.84 | 59.59 | 0.2751 | -1084.0 | -1008.7 | |
| 0 | 4 | 0 | 2 | 8.87 | 292.28 | -14.03 | 60.66 | 0.2760 | -856.0 | -833.3 | |
| 0 | 3 | 0 | 1 | 8.44 | 292.22 | -14.09 | 62.15 | 0.2736 | -577.0 | -633.8 | |
| 0 | 13 | 0 | 7 | 9.91 | 292.16 | -14.15 | 57.63 | 0.2864 | -795.0 | -833.9 | |
| 0 | 12 | 0 | 6 | 7.86 | 292.00 | -14.31 | 64.42 | 0.2727 | -433.0 | -405.0 | |
| 0 | 64 | 0 | 33 | 10.41 | 291.61 | -14.70 | 57.11 | 0.2985 | -1361.0 | -936.4 | |
| 0 | 6 | 0 | 3 | 11.19 | 291.21 | -15.10 | 55.64 | 0.3110 | -710.0 | -706.7 | |
| 0 | 4 | 0 | 2 | 10.99 | 290.86 | -15.45 | 56.77 | 0.3141 | -594.0 | -592.8 | |
| 0 | 5 | 0 | 3 | 14.35 | 284.08 | -22.23 | 57.94 | 0.4344 | -655.0 | -561.9 | |
| Proj. U | - Projected umbra area in millionths of solar disc, negative values indicate | |
|
that the umbra consists of fragmented regions which cannot be separated without losing umbral area. In this way several spots (intensity minima in the umbra) have a common umbra, e.g. -2 means that the given spot shares an umbra with spot No.2, and the common U value is indicated at spot No.2. |
||
| Proj. WS | - Projected whole spot area in millionths of solar disc, negative values indicate | |
|
that several umbras have a common penumbra, e.g. -7 means that the given umbra shares a penumbra with umbra No.7, and the WS value is indicated at No.7. |
||
| Corr. U | - Corrected umbra area in millionths of solar hemisphere, for negative values see above | |
| Corr. WS | - Corrected whole spot area in millionths of solar hemisphere, for negative values see above | |
| B | - Heliographic latitude B; positive: North, negative: South | |
| L | - Heliographic longitude L | |
| LCM | - Longitudinal distance from the Sun's central meridian | |
| Pos. angle | - Position angle | |
| r | - Distance from the centre of Sun's disc in terms of Sun's radius | |
| MU | - Mean magnetic field within the umbra contour averaged the pixel values with sign. | |
| MP | - Mean magnetic field within the penumbra contour averaged the pixel values with sign. | |