SOHO MDI 2000-11-24 01:35:32 UT
| group | Proj. U | Proj. WS | Corr. U | Corr. WS | B | L | LCM | Pos. angle | r | MU | MP |
| 202 | 1630 | 107 | 853 | 20.37 | 357.54 | 0.29 | 359.15 | 0.3210 | 1373.5 | 386.1 | |
|
previous
or next observation for the same group /
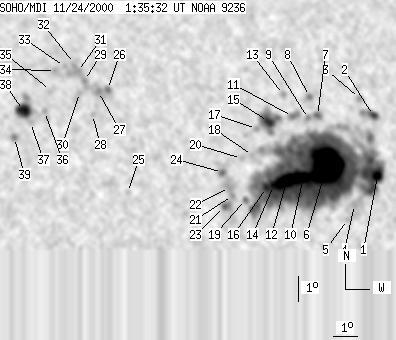
back to the solar disc SOHO MDI 2000-11-24 01:35:32 UT |
| spot | Proj. U | Proj. WS | Corr. U | Corr. WS | B | L | LCM | Pos. angle | r | MU | MP |
| 9 | 1262 | 5 | 658 | 19.73 | 1.31 | 4.07 | 347.87 | 0.3190 | -809.0 | 591.3 | |
| 4 | 18 | 2 | 10 | 22.17 | 1.22 | 3.97 | 349.64 | 0.3580 | -470.8 | -81.4 | |
| 0 | 5 | 0 | 3 | 22.87 | 0.65 | 3.40 | 351.41 | 0.3677 | -665.0 | -571.0 | |
| 0 | 17 | 0 | 9 | 18.57 | 0.35 | 3.11 | 349.99 | 0.2969 | 180.0 | 225.0 | |
| 0 | 3 | 0 | 1 | 17.97 | 0.06 | 2.81 | 350.57 | 0.2861 | -532.0 | -478.9 | |
| 108 | -1 | 57 | -1 | 20.10 | 359.24 | 1.99 | 354.11 | 0.3196 | 1940.5 | 999999 | |
| 0 | 8 | 0 | 4 | 22.17 | 358.90 | 1.65 | 355.66 | 0.3532 | 806.0 | 578.5 | |
| 0 | 6 | 0 | 3 | 22.95 | 358.57 | 1.32 | 356.65 | 0.3655 | -841.0 | -641.2 | |
| 0 | 6 | 0 | 3 | 22.05 | 358.52 | 1.27 | 356.62 | 0.3507 | 731.0 | 432.0 | |
| 46 | -1 | 24 | -1 | 19.69 | 358.30 | 1.05 | 356.81 | 0.3116 | 2161.2 | 999999 | |
| 0 | 13 | 0 | 7 | 22.13 | 357.86 | 0.61 | 358.38 | 0.3516 | 815.0 | 426.6 | |
| -10 | -1 | -10 | -1 | 19.49 | 357.61 | 0.36 | 358.90 | 0.3079 | 999999 | 999999 | |
| 0 | 5 | 0 | 3 | 23.03 | 357.49 | 0.24 | 359.39 | 0.3663 | 745.0 | 668.4 | |
| 3 | -1 | 2 | -1 | 19.33 | 357.08 | -0.17 | 0.53 | 0.3051 | 1689.1 | 999999 | |
| 10 | 52 | 5 | 27 | 21.93 | 356.87 | -0.38 | 1.02 | 0.3482 | 677.8 | 339.7 | |
| 6 | -1 | 3 | -1 | 19.25 | 356.79 | -0.45 | 1.42 | 0.3039 | 1506.3 | 999999 | |
| 0 | 5 | 0 | 3 | 21.64 | 356.38 | -0.87 | 2.38 | 0.3437 | 449.0 | 296.8 | |
| 0 | 12 | 0 | 6 | 20.54 | 356.22 | -1.03 | 2.98 | 0.3257 | 124.0 | 279.8 | |
| 0 | 7 | 0 | 3 | 18.77 | 355.95 | -1.30 | 4.18 | 0.2965 | 565.0 | 384.2 | |
| 0 | 6 | 0 | 3 | 20.42 | 355.77 | -1.48 | 4.30 | 0.3242 | -99.0 | -133.8 | |
| 0 | 4 | 0 | 2 | 18.93 | 355.42 | -1.83 | 5.81 | 0.2999 | 658.0 | 501.1 | |
| 0 | 2 | 0 | 1 | 19.25 | 355.29 | -1.96 | 6.08 | 0.3055 | 551.0 | 410.8 | |
| 0 | 13 | 0 | 7 | 18.49 | 355.10 | -2.15 | 7.00 | 0.2932 | -1131.0 | -754.5 | |
| 0 | 8 | 0 | 4 | 19.85 | 355.00 | -2.25 | 6.74 | 0.3160 | -1009.0 | -795.0 | |
| 0 | 4 | 0 | 2 | 19.04 | 351.15 | -6.10 | 18.57 | 0.3169 | -651.0 | -472.4 | |
| 0 | 5 | 0 | 3 | 23.23 | 350.13 | -7.12 | 17.19 | 0.3869 | -1028.0 | -788.9 | |
| 0 | 23 | 0 | 12 | 23.15 | 349.76 | -7.49 | 18.10 | 0.3874 | -1115.0 | -886.7 | |
| 0 | 3 | 0 | 2 | 22.20 | 349.56 | -7.69 | 19.42 | 0.3741 | -561.0 | -553.8 | |
| 0 | 12 | 0 | 6 | 23.60 | 349.14 | -8.11 | 19.06 | 0.3974 | -1050.0 | -863.8 | |
| 0 | 14 | 0 | 8 | 23.10 | 348.96 | -8.29 | 19.91 | 0.3910 | -824.0 | -622.5 | |
| 0 | 21 | 0 | 12 | 23.97 | 348.82 | -8.43 | 19.41 | 0.4047 | -846.0 | -826.3 | |
| 0 | 6 | 0 | 3 | 24.30 | 348.67 | -8.58 | 19.43 | 0.4104 | -864.0 | -772.7 | |
| 0 | 4 | 0 | 2 | 24.17 | 348.26 | -8.99 | 20.40 | 0.4108 | -735.0 | -631.2 | |
| 0 | 5 | 0 | 3 | 24.01 | 347.89 | -9.36 | 21.32 | 0.4105 | -619.0 | -652.8 | |
| 0 | 7 | 0 | 4 | 23.18 | 347.73 | -9.51 | 22.47 | 0.3993 | -768.0 | -583.0 | |
| 0 | 12 | 0 | 6 | 22.31 | 347.54 | -9.71 | 23.82 | 0.3879 | -856.0 | -651.7 | |
| 0 | 5 | 0 | 2 | 21.86 | 346.99 | -10.26 | 25.55 | 0.3851 | -639.0 | -615.2 | |
| 16 | 50 | 9 | 27 | 22.35 | 346.66 | -10.59 | 25.66 | 0.3944 | -1277.8 | -715.0 | |
| 0 | 7 | 0 | 4 | 21.25 | 346.36 | -10.89 | 27.66 | 0.3809 | -1129.0 | -851.2 | |
| Proj. U | - Projected umbra area in millionths of solar disc, negative values indicate | |
|
that the umbra consists of fragmented regions which cannot be separated without losing umbral area. In this way several spots (intensity minima in the umbra) have a common umbra, e.g. -2 means that the given spot shares an umbra with spot No.2, and the common U value is indicated at spot No.2. |
||
| Proj. WS | - Projected whole spot area in millionths of solar disc, negative values indicate | |
|
that several umbras have a common penumbra, e.g. -7 means that the given umbra shares a penumbra with umbra No.7, and the WS value is indicated at No.7. |
||
| Corr. U | - Corrected umbra area in millionths of solar hemisphere, for negative values see above | |
| Corr. WS | - Corrected whole spot area in millionths of solar hemisphere, for negative values see above | |
| B | - Heliographic latitude B; positive: North, negative: South | |
| L | - Heliographic longitude L | |
| LCM | - Longitudinal distance from the Sun's central meridian | |
| Pos. angle | - Position angle | |
| r | - Distance from the centre of Sun's disc in terms of Sun's radius | |
| MU | - Mean magnetic field within the umbra contour averaged the pixel values with sign. | |
| MP | - Mean magnetic field within the penumbra contour averaged the pixel values with sign. | |