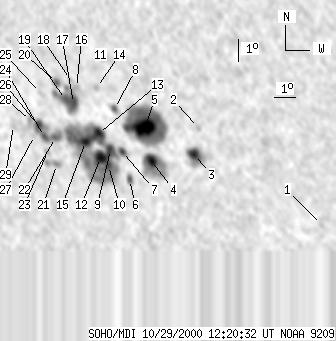
SOHO MDI 2000-10-29 12:20:32 UT
| group | Proj. U | Proj. WS | Corr. U | Corr. WS | B | L | LCM | Pos. angle | r | MU | MP |
| 132 | 811 | 82 | 512 | -22.65 | 306.29 | -27.62 | 136.42 | 0.6226 | -753.5 | -336.7 | |
|
previous
or next observation for the same group /
back to the solar disc SOHO MDI 2000-10-29 12:20:32 UT |
| spot | Proj. U | Proj. WS | Corr. U | Corr. WS | B | L | LCM | Pos. angle | r | MU | MP |
| 0 | 4 | 0 | 3 | -26.11 | 315.26 | -18.65 | 150.44 | 0.5842 | -582.0 | -526.1 | |
| 0 | 4 | 0 | 2 | -22.01 | 310.40 | -23.51 | 140.01 | 0.5777 | -690.0 | -510.1 | |
| 10 | 37 | 6 | 23 | -23.19 | 310.00 | -23.91 | 140.94 | 0.5935 | -1210.6 | -650.8 | |
| 10 | 71 | 6 | 44 | -23.52 | 307.94 | -25.97 | 139.08 | 0.6153 | -1291.2 | -475.2 | |
| 28 | 192 | 17 | 119 | -22.14 | 307.90 | -26.01 | 137.39 | 0.6023 | -1626.3 | -773.2 | |
| 3 | 9 | 2 | 6 | -24.40 | 306.70 | -27.21 | 138.82 | 0.6347 | -505.7 | -498.9 | |
| 4 | 307 | 2 | 196 | -23.18 | 306.65 | -27.26 | 137.35 | 0.6238 | -1103.8 | -401.9 | |
| 3 | 8 | 2 | 5 | -21.33 | 306.67 | -27.24 | 135.12 | 0.6066 | -835.2 | -664.9 | |
| 8 | -7 | 5 | -7 | -23.12 | 306.10 | -27.81 | 136.73 | 0.6283 | -1348.4 | 999999 | |
| 4 | -7 | 3 | -7 | -23.82 | 305.84 | -28.07 | 137.30 | 0.6372 | -933.1 | 999999 | |
| 0 | 7 | 0 | 4 | -19.21 | 306.56 | -27.35 | 132.29 | 0.5886 | 603.0 | 587.9 | |
| 12 | -7 | 8 | -7 | -23.49 | 305.54 | -28.37 | 136.62 | 0.6369 | -1098.8 | 999999 | |
| 7 | -7 | 4 | -7 | -22.44 | 305.68 | -28.23 | 135.51 | 0.6262 | -1473.1 | 999999 | |
| 0 | 4 | 0 | 3 | -20.46 | 306.00 | -27.91 | 133.36 | 0.6054 | 688.0 | 613.3 | |
| 7 | -7 | 4 | -7 | -22.81 | 304.98 | -28.93 | 135.29 | 0.6362 | -934.0 | 999999 | |
| 0 | 7 | 0 | 4 | -20.50 | 305.06 | -28.85 | 132.49 | 0.6153 | 939.0 | 899.4 | |
| 13 | 58 | 8 | 37 | -21.19 | 304.77 | -29.14 | 133.10 | 0.6241 | 513.4 | 699.7 | |
| 0 | 3 | 0 | 2 | -20.17 | 304.85 | -29.06 | 131.87 | 0.6146 | 764.0 | 650.8 | |
| 6 | -17 | 4 | -17 | -21.03 | 304.42 | -29.48 | 132.58 | 0.6262 | 868.4 | 999999 | |
| 3 | 8 | 2 | 5 | -20.32 | 304.15 | -29.76 | 131.43 | 0.6231 | 610.4 | 497.6 | |
| 0 | 17 | 0 | 11 | -23.88 | 303.30 | -30.60 | 135.03 | 0.6610 | -501.0 | -466.4 | |
| 3 | 48 | 2 | 31 | -22.70 | 303.56 | -30.35 | 133.85 | 0.6487 | 1080.6 | 553.4 | |
| 0 | 4 | 0 | 3 | -23.33 | 303.01 | -30.90 | 134.11 | 0.6592 | -564.0 | -428.4 | |
| 5 | -22 | 3 | -22 | -22.68 | 303.03 | -30.88 | 133.35 | 0.6536 | 592.7 | 999999 | |
| 0 | 5 | 0 | 3 | -20.78 | 303.29 | -30.62 | 131.24 | 0.6356 | -660.0 | -474.2 | |
| 6 | -22 | 4 | -22 | -22.21 | 302.85 | -31.06 | 132.63 | 0.6515 | -172.2 | 999999 | |
| 0 | 2 | 0 | 1 | -22.66 | 302.54 | -31.36 | 132.91 | 0.6581 | 232.0 | 284.4 | |
| 0 | 11 | 0 | 7 | -22.01 | 302.51 | -31.40 | 132.09 | 0.6533 | -578.0 | -336.8 | |
| 0 | 5 | 0 | 3 | -22.27 | 301.61 | -32.30 | 131.65 | 0.6641 | -354.0 | -513.5 | |
| Proj. U | - Projected umbra area in millionths of solar disc, negative values indicate | |
|
that the umbra consists of fragmented regions which cannot be separated without losing umbral area. In this way several spots (intensity minima in the umbra) have a common umbra, e.g. -2 means that the given spot shares an umbra with spot No.2, and the common U value is indicated at spot No.2. |
||
| Proj. WS | - Projected whole spot area in millionths of solar disc, negative values indicate | |
|
that several umbras have a common penumbra, e.g. -7 means that the given umbra shares a penumbra with umbra No.7, and the WS value is indicated at No.7. |
||
| Corr. U | - Corrected umbra area in millionths of solar hemisphere, for negative values see above | |
| Corr. WS | - Corrected whole spot area in millionths of solar hemisphere, for negative values see above | |
| B | - Heliographic latitude B; positive: North, negative: South | |
| L | - Heliographic longitude L | |
| LCM | - Longitudinal distance from the Sun's central meridian | |
| Pos. angle | - Position angle | |
| r | - Distance from the centre of Sun's disc in terms of Sun's radius | |
| MU | - Mean magnetic field within the umbra contour averaged the pixel values with sign. | |
| MP | - Mean magnetic field within the penumbra contour averaged the pixel values with sign. | |