SOHO MDI 2000-10-29 03:11:32 UT
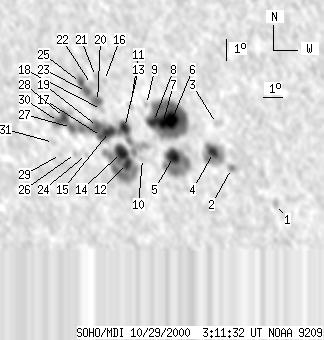
| group | Proj. U | Proj. WS | Corr. U | Corr. WS | B | L | LCM | Pos. angle | r | MU | MP |
| 145 | 749 | 97 | 498 | -22.68 | 306.46 | -32.47 | 132.10 | 0.6695 | -734.0 | -341.1 | |
|
previous
or next observation for the same group /
back to the solar disc SOHO MDI 2000-10-29 03:11:32 UT |
| spot | Proj. U | Proj. WS | Corr. U | Corr. WS | B | L | LCM | Pos. angle | r | MU | MP |
| 0 | 7 | 0 | 4 | -25.50 | 312.53 | -26.41 | 140.88 | 0.6386 | -716.0 | -509.2 | |
| 0 | 6 | 0 | 4 | -23.98 | 310.74 | -28.20 | 137.39 | 0.6401 | -157.0 | -73.7 | |
| 0 | 7 | 0 | 5 | -22.04 | 310.47 | -28.47 | 134.82 | 0.6252 | -731.0 | -693.9 | |
| 8 | 56 | 5 | 36 | -23.31 | 310.03 | -28.90 | 135.94 | 0.6406 | -1124.4 | -551.8 | |
| 18 | 86 | 12 | 57 | -23.57 | 308.03 | -30.91 | 134.42 | 0.6615 | -1103.8 | -347.8 | |
| 17 | 182 | 11 | 118 | -22.00 | 308.32 | -30.61 | 132.80 | 0.6458 | -1673.8 | -735.6 | |
| 8 | -6 | 5 | -6 | -22.15 | 307.85 | -31.08 | 132.56 | 0.6516 | -1132.3 | 999999 | |
| 9 | -6 | 6 | -6 | -22.08 | 307.43 | -31.51 | 132.12 | 0.6552 | -863.0 | 999999 | |
| 0 | 2 | 0 | 2 | -21.36 | 307.26 | -31.67 | 131.09 | 0.6511 | -510.0 | -407.2 | |
| 0 | 3 | 0 | 2 | -23.73 | 306.45 | -32.49 | 133.26 | 0.6776 | -530.0 | -439.5 | |
| 0 | 5 | 0 | 3 | -21.48 | 306.45 | -32.48 | 130.56 | 0.6602 | -626.0 | -466.3 | |
| 8 | 330 | 6 | 224 | -23.98 | 305.62 | -33.32 | 132.89 | 0.6873 | -865.1 | -243.8 | |
| 10 | -12 | 7 | -12 | -22.41 | 305.91 | -33.02 | 131.25 | 0.6725 | -1188.9 | 999999 | |
| 16 | -12 | 11 | -12 | -23.51 | 305.45 | -33.48 | 132.20 | 0.6853 | -1013.0 | 999999 | |
| 12 | -12 | 8 | -12 | -22.62 | 305.10 | -33.83 | 130.86 | 0.6819 | -952.4 | 999999 | |
| 0 | 3 | 0 | 2 | -20.42 | 305.43 | -33.50 | 128.42 | 0.6625 | 707.0 | 717.7 | |
| 3 | -12 | 2 | -12 | -22.86 | 304.63 | -34.30 | 130.78 | 0.6882 | -233.3 | 999999 | |
| 0 | 3 | 0 | 2 | -21.68 | 304.96 | -33.97 | 129.61 | 0.6764 | -223.0 | -169.1 | |
| 7 | -12 | 5 | -12 | -22.43 | 304.55 | -34.38 | 130.21 | 0.6859 | 87.9 | 999999 | |
| 6 | 12 | 4 | 8 | -21.34 | 304.85 | -34.09 | 129.11 | 0.6751 | 796.6 | 718.3 | |
| 0 | 4 | 0 | 3 | -20.27 | 305.03 | -33.91 | 127.91 | 0.6656 | 725.0 | 599.1 | |
| 0 | 10 | 0 | 6 | -20.62 | 304.74 | -34.20 | 128.13 | 0.6711 | 876.0 | 894.7 | |
| 5 | 18 | 3 | 12 | -20.94 | 304.40 | -34.53 | 128.27 | 0.6767 | 1014.6 | 653.1 | |
| 0 | 3 | 0 | 2 | -23.69 | 303.61 | -35.32 | 130.99 | 0.7038 | -430.0 | -390.1 | |
| 4 | -23 | 2 | -23 | -20.56 | 304.20 | -34.73 | 127.65 | 0.6761 | 452.5 | 999999 | |
| 0 | 3 | 0 | 2 | -23.67 | 303.05 | -35.89 | 130.56 | 0.7090 | -292.0 | -259.7 | |
| 4 | -12 | 3 | -12 | -22.54 | 303.19 | -35.74 | 129.32 | 0.6998 | 860.6 | 999999 | |
| 7 | -12 | 5 | -12 | -22.12 | 302.95 | -35.98 | 128.65 | 0.6992 | -465.6 | 999999 | |
| 0 | 3 | 0 | 2 | -23.75 | 302.23 | -36.70 | 130.07 | 0.7172 | 279.0 | 232.9 | |
| 3 | -12 | 2 | -12 | -22.31 | 302.59 | -36.35 | 128.61 | 0.7041 | 75.7 | 999999 | |
| 0 | 6 | 0 | 4 | -23.24 | 302.03 | -36.90 | 129.33 | 0.7156 | -221.0 | -223.4 | |
| Proj. U | - Projected umbra area in millionths of solar disc, negative values indicate | |
|
that the umbra consists of fragmented regions which cannot be separated without losing umbral area. In this way several spots (intensity minima in the umbra) have a common umbra, e.g. -2 means that the given spot shares an umbra with spot No.2, and the common U value is indicated at spot No.2. |
||
| Proj. WS | - Projected whole spot area in millionths of solar disc, negative values indicate | |
|
that several umbras have a common penumbra, e.g. -7 means that the given umbra shares a penumbra with umbra No.7, and the WS value is indicated at No.7. |
||
| Corr. U | - Corrected umbra area in millionths of solar hemisphere, for negative values see above | |
| Corr. WS | - Corrected whole spot area in millionths of solar hemisphere, for negative values see above | |
| B | - Heliographic latitude B; positive: North, negative: South | |
| L | - Heliographic longitude L | |
| LCM | - Longitudinal distance from the Sun's central meridian | |
| Pos. angle | - Position angle | |
| r | - Distance from the centre of Sun's disc in terms of Sun's radius | |
| MU | - Mean magnetic field within the umbra contour averaged the pixel values with sign. | |
| MP | - Mean magnetic field within the penumbra contour averaged the pixel values with sign. | |