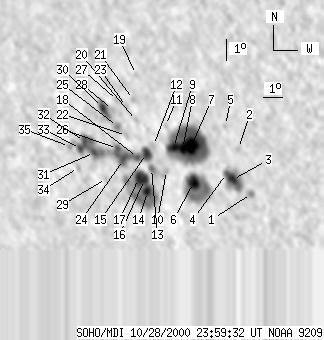
SOHO MDI 2000-10-28 23:59:32 UT
| group | Proj. U | Proj. WS | Corr. U | Corr. WS | B | L | LCM | Pos. angle | r | MU | MP |
| 127 | 685 | 84 | 467 | -22.66 | 306.59 | -34.10 | 130.76 | 0.6850 | -784.8 | -337.7 | |
|
previous
or next observation for the same group /
back to the solar disc SOHO MDI 2000-10-28 23:59:32 UT |
| spot | Proj. U | Proj. WS | Corr. U | Corr. WS | B | L | LCM | Pos. angle | r | MU | MP |
| 0 | 7 | 0 | 5 | -23.95 | 310.82 | -29.87 | 135.80 | 0.6553 | -253.0 | -58.9 | |
| 0 | 4 | 0 | 3 | -22.00 | 310.67 | -30.03 | 133.34 | 0.6402 | -922.0 | -760.1 | |
| 8 | 47 | 5 | 31 | -23.37 | 310.04 | -30.65 | 134.42 | 0.6576 | -1152.3 | -696.8 | |
| 2 | -3 | 1 | -3 | -23.12 | 309.81 | -30.88 | 133.92 | 0.6577 | -922.5 | 999999 | |
| 0 | 3 | 0 | 2 | -21.04 | 310.26 | -30.43 | 131.78 | 0.6362 | -487.0 | -455.4 | |
| 15 | 91 | 10 | 61 | -23.59 | 308.05 | -32.64 | 132.98 | 0.6781 | -1135.8 | -366.5 | |
| 17 | 192 | 11 | 127 | -21.97 | 308.38 | -32.31 | 131.32 | 0.6623 | -1622.2 | -656.1 | |
| 8 | -7 | 5 | -7 | -22.12 | 307.90 | -32.79 | 131.11 | 0.6682 | -1204.3 | 999999 | |
| 11 | -7 | 7 | -7 | -22.10 | 307.46 | -33.23 | 130.73 | 0.6724 | -884.0 | 999999 | |
| 0 | 7 | 0 | 5 | -23.12 | 306.82 | -33.87 | 131.45 | 0.6861 | -631.0 | -663.1 | |
| 0 | 2 | 0 | 2 | -21.17 | 307.31 | -33.38 | 129.46 | 0.6669 | -302.0 | -307.4 | |
| 0 | 5 | 0 | 3 | -22.06 | 306.47 | -34.22 | 129.90 | 0.6818 | -359.0 | -304.0 | |
| 0 | 11 | 0 | 8 | -23.07 | 306.08 | -34.62 | 130.81 | 0.6929 | -763.0 | -850.9 | |
| 5 | 125 | 3 | 87 | -24.10 | 305.56 | -35.13 | 131.62 | 0.7052 | -799.4 | -174.4 | |
| 9 | 65 | 6 | 45 | -22.43 | 306.01 | -34.68 | 129.99 | 0.6889 | -1103.5 | -495.0 | |
| 15 | -14 | 10 | -14 | -23.58 | 305.56 | -35.13 | 131.02 | 0.7013 | -977.3 | 999999 | |
| -16 | -14 | -16 | -14 | -23.55 | 305.26 | -35.43 | 130.76 | 0.7039 | 999999 | 999999 | |
| 3 | -15 | 2 | -15 | -22.63 | 305.49 | -35.20 | 129.84 | 0.6953 | -970.9 | 999999 | |
| 0 | 2 | 0 | 2 | -19.06 | 306.39 | -34.30 | 126.07 | 0.6613 | 628.0 | 507.8 | |
| 0 | 3 | 0 | 2 | -21.02 | 305.89 | -34.80 | 128.19 | 0.6801 | -159.0 | -9.7 | |
| 0 | 3 | 0 | 2 | -20.13 | 305.98 | -34.71 | 127.13 | 0.6730 | 663.0 | 653.8 | |
| 0 | 4 | 0 | 3 | -21.70 | 305.20 | -35.49 | 128.50 | 0.6917 | -408.0 | -316.0 | |
| 0 | 4 | 0 | 3 | -20.44 | 305.54 | -35.15 | 127.21 | 0.6796 | 859.0 | 713.1 | |
| 8 | -15 | 6 | -15 | -22.75 | 304.73 | -35.96 | 129.43 | 0.7034 | -602.0 | 999999 | |
| 0 | 9 | 0 | 6 | -21.33 | 304.84 | -35.85 | 127.79 | 0.6927 | 785.0 | 659.1 | |
| 3 | -15 | 2 | -15 | -22.28 | 304.57 | -36.13 | 128.75 | 0.7019 | 92.8 | 999999 | |
| 0 | 6 | 0 | 4 | -20.21 | 305.15 | -35.54 | 126.63 | 0.6821 | 747.0 | 595.1 | |
| 0 | 3 | 0 | 2 | -20.61 | 304.79 | -35.90 | 126.87 | 0.6884 | 866.0 | 817.7 | |
| 0 | 4 | 0 | 3 | -23.63 | 303.56 | -37.13 | 129.64 | 0.7205 | -534.0 | -458.0 | |
| 7 | 21 | 5 | 14 | -20.55 | 304.30 | -36.40 | 126.44 | 0.6930 | 684.9 | 722.1 | |
| 5 | 54 | 3 | 38 | -22.52 | 303.29 | -37.40 | 128.14 | 0.7157 | 855.4 | 178.0 | |
| 6 | -31 | 4 | -31 | -22.07 | 302.91 | -37.78 | 127.34 | 0.7165 | -632.3 | 999999 | |
| 5 | -31 | 4 | -31 | -22.39 | 302.59 | -38.10 | 127.51 | 0.7216 | 86.9 | 999999 | |
| 0 | 5 | 0 | 3 | -23.23 | 302.21 | -38.48 | 128.24 | 0.7305 | -616.0 | -458.6 | |
| 0 | 8 | 0 | 6 | -22.33 | 302.03 | -38.66 | 127.07 | 0.7266 | -608.0 | -572.4 | |
| Proj. U | - Projected umbra area in millionths of solar disc, negative values indicate | |
|
that the umbra consists of fragmented regions which cannot be separated without losing umbral area. In this way several spots (intensity minima in the umbra) have a common umbra, e.g. -2 means that the given spot shares an umbra with spot No.2, and the common U value is indicated at spot No.2. |
||
| Proj. WS | - Projected whole spot area in millionths of solar disc, negative values indicate | |
|
that several umbras have a common penumbra, e.g. -7 means that the given umbra shares a penumbra with umbra No.7, and the WS value is indicated at No.7. |
||
| Corr. U | - Corrected umbra area in millionths of solar hemisphere, for negative values see above | |
| Corr. WS | - Corrected whole spot area in millionths of solar hemisphere, for negative values see above | |
| B | - Heliographic latitude B; positive: North, negative: South | |
| L | - Heliographic longitude L | |
| LCM | - Longitudinal distance from the Sun's central meridian | |
| Pos. angle | - Position angle | |
| r | - Distance from the centre of Sun's disc in terms of Sun's radius | |
| MU | - Mean magnetic field within the umbra contour averaged the pixel values with sign. | |
| MP | - Mean magnetic field within the penumbra contour averaged the pixel values with sign. | |